


Ethereum’s market structure is becoming increasingly interesting. Coins are moving away from exchanges, more ETH is being locked into staking, and stablecoin liquidity appears to be shifting toward Ethereum-based markets.
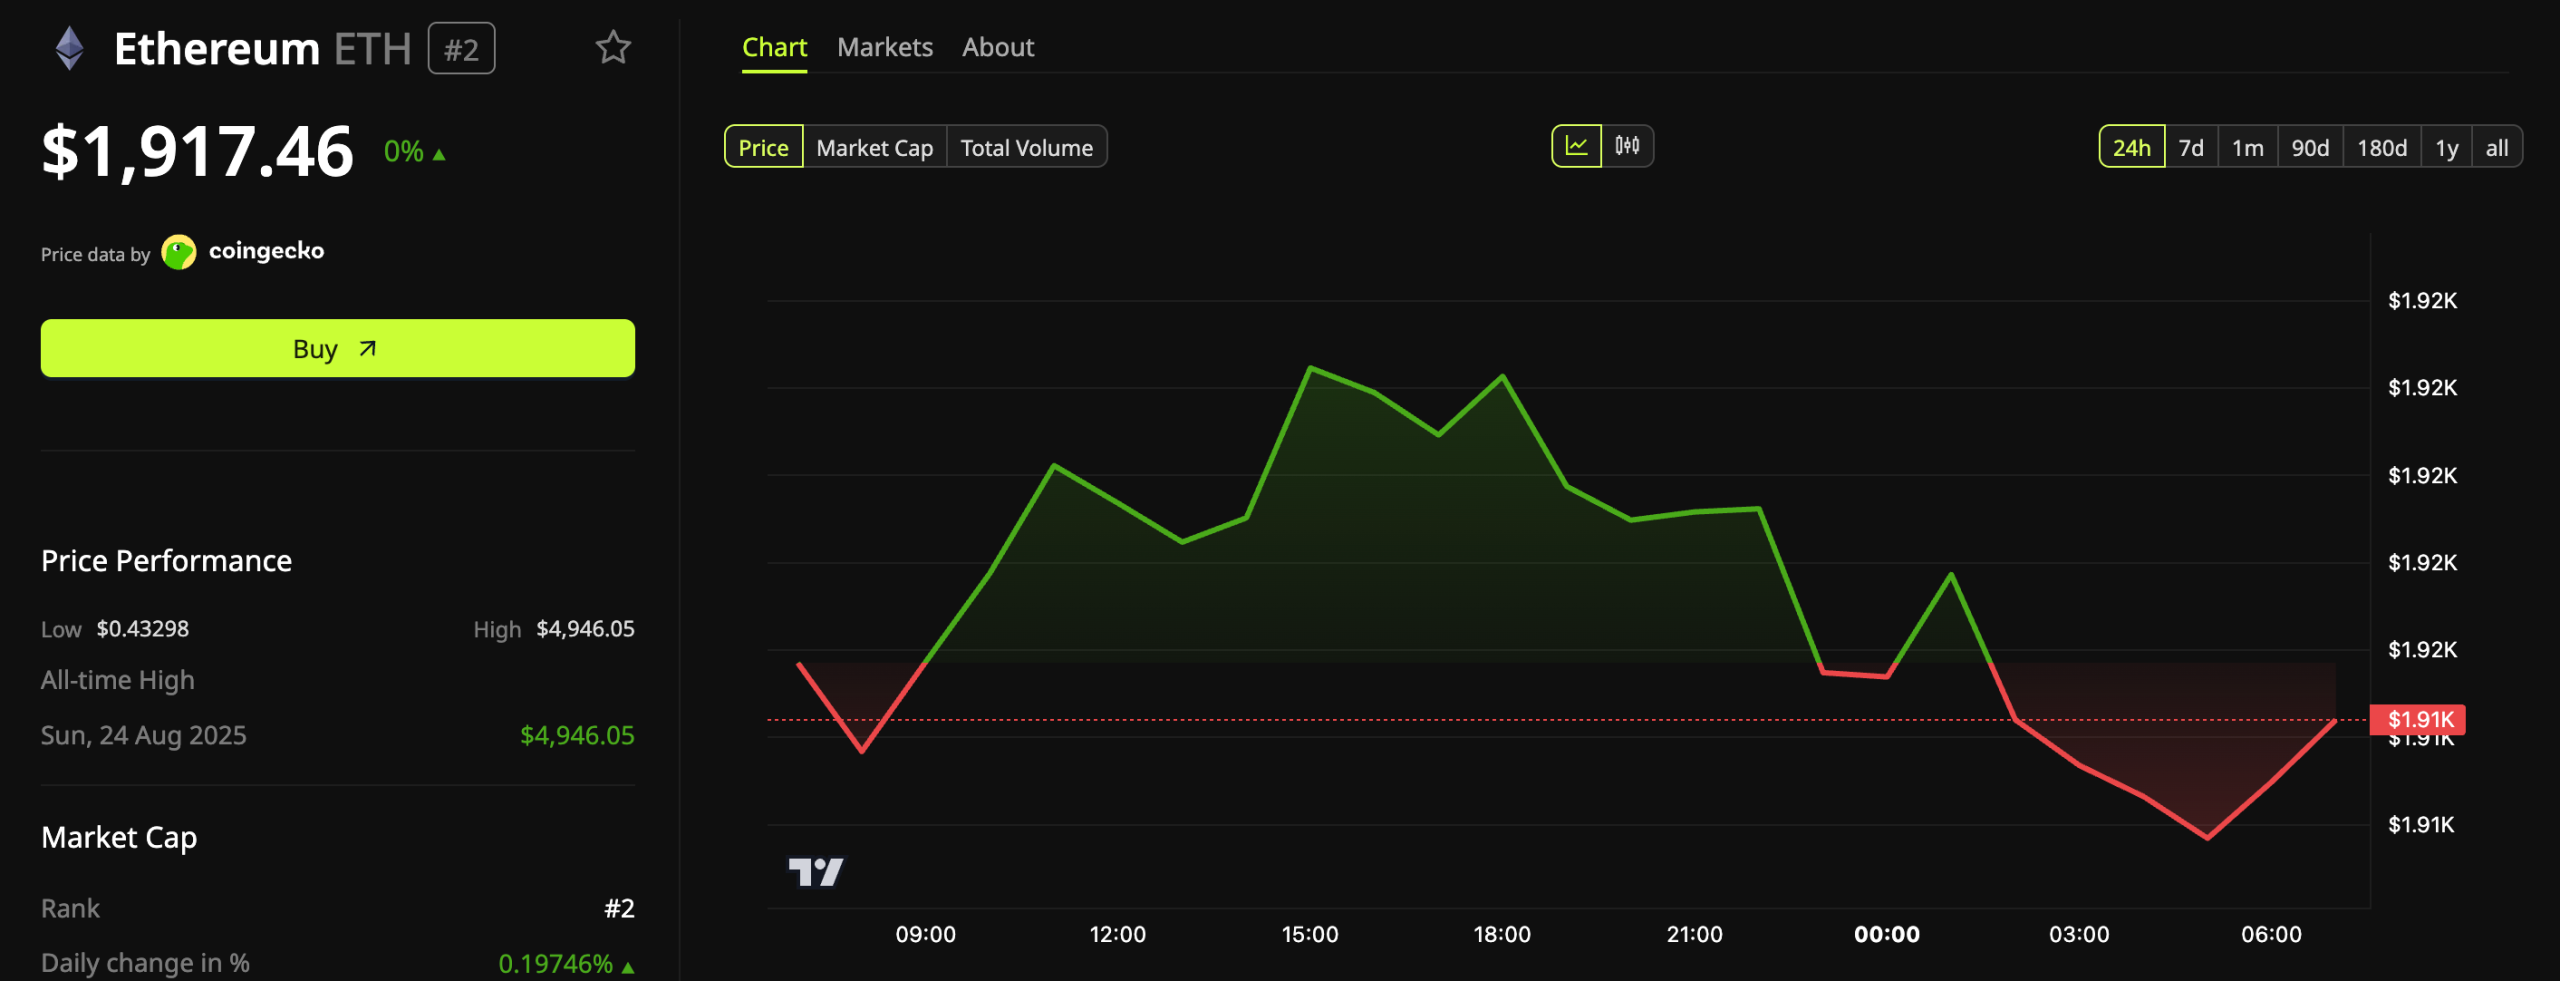
Yet despite these changes, ETH has struggled to make a decisive move and remains around the $1,900 area.
The contrast is drawing attention from onchain analysts: underlying market conditions are changing, but the price chart has yet to reflect the shift.
Ethereum Supply Is Becoming Less Liquid
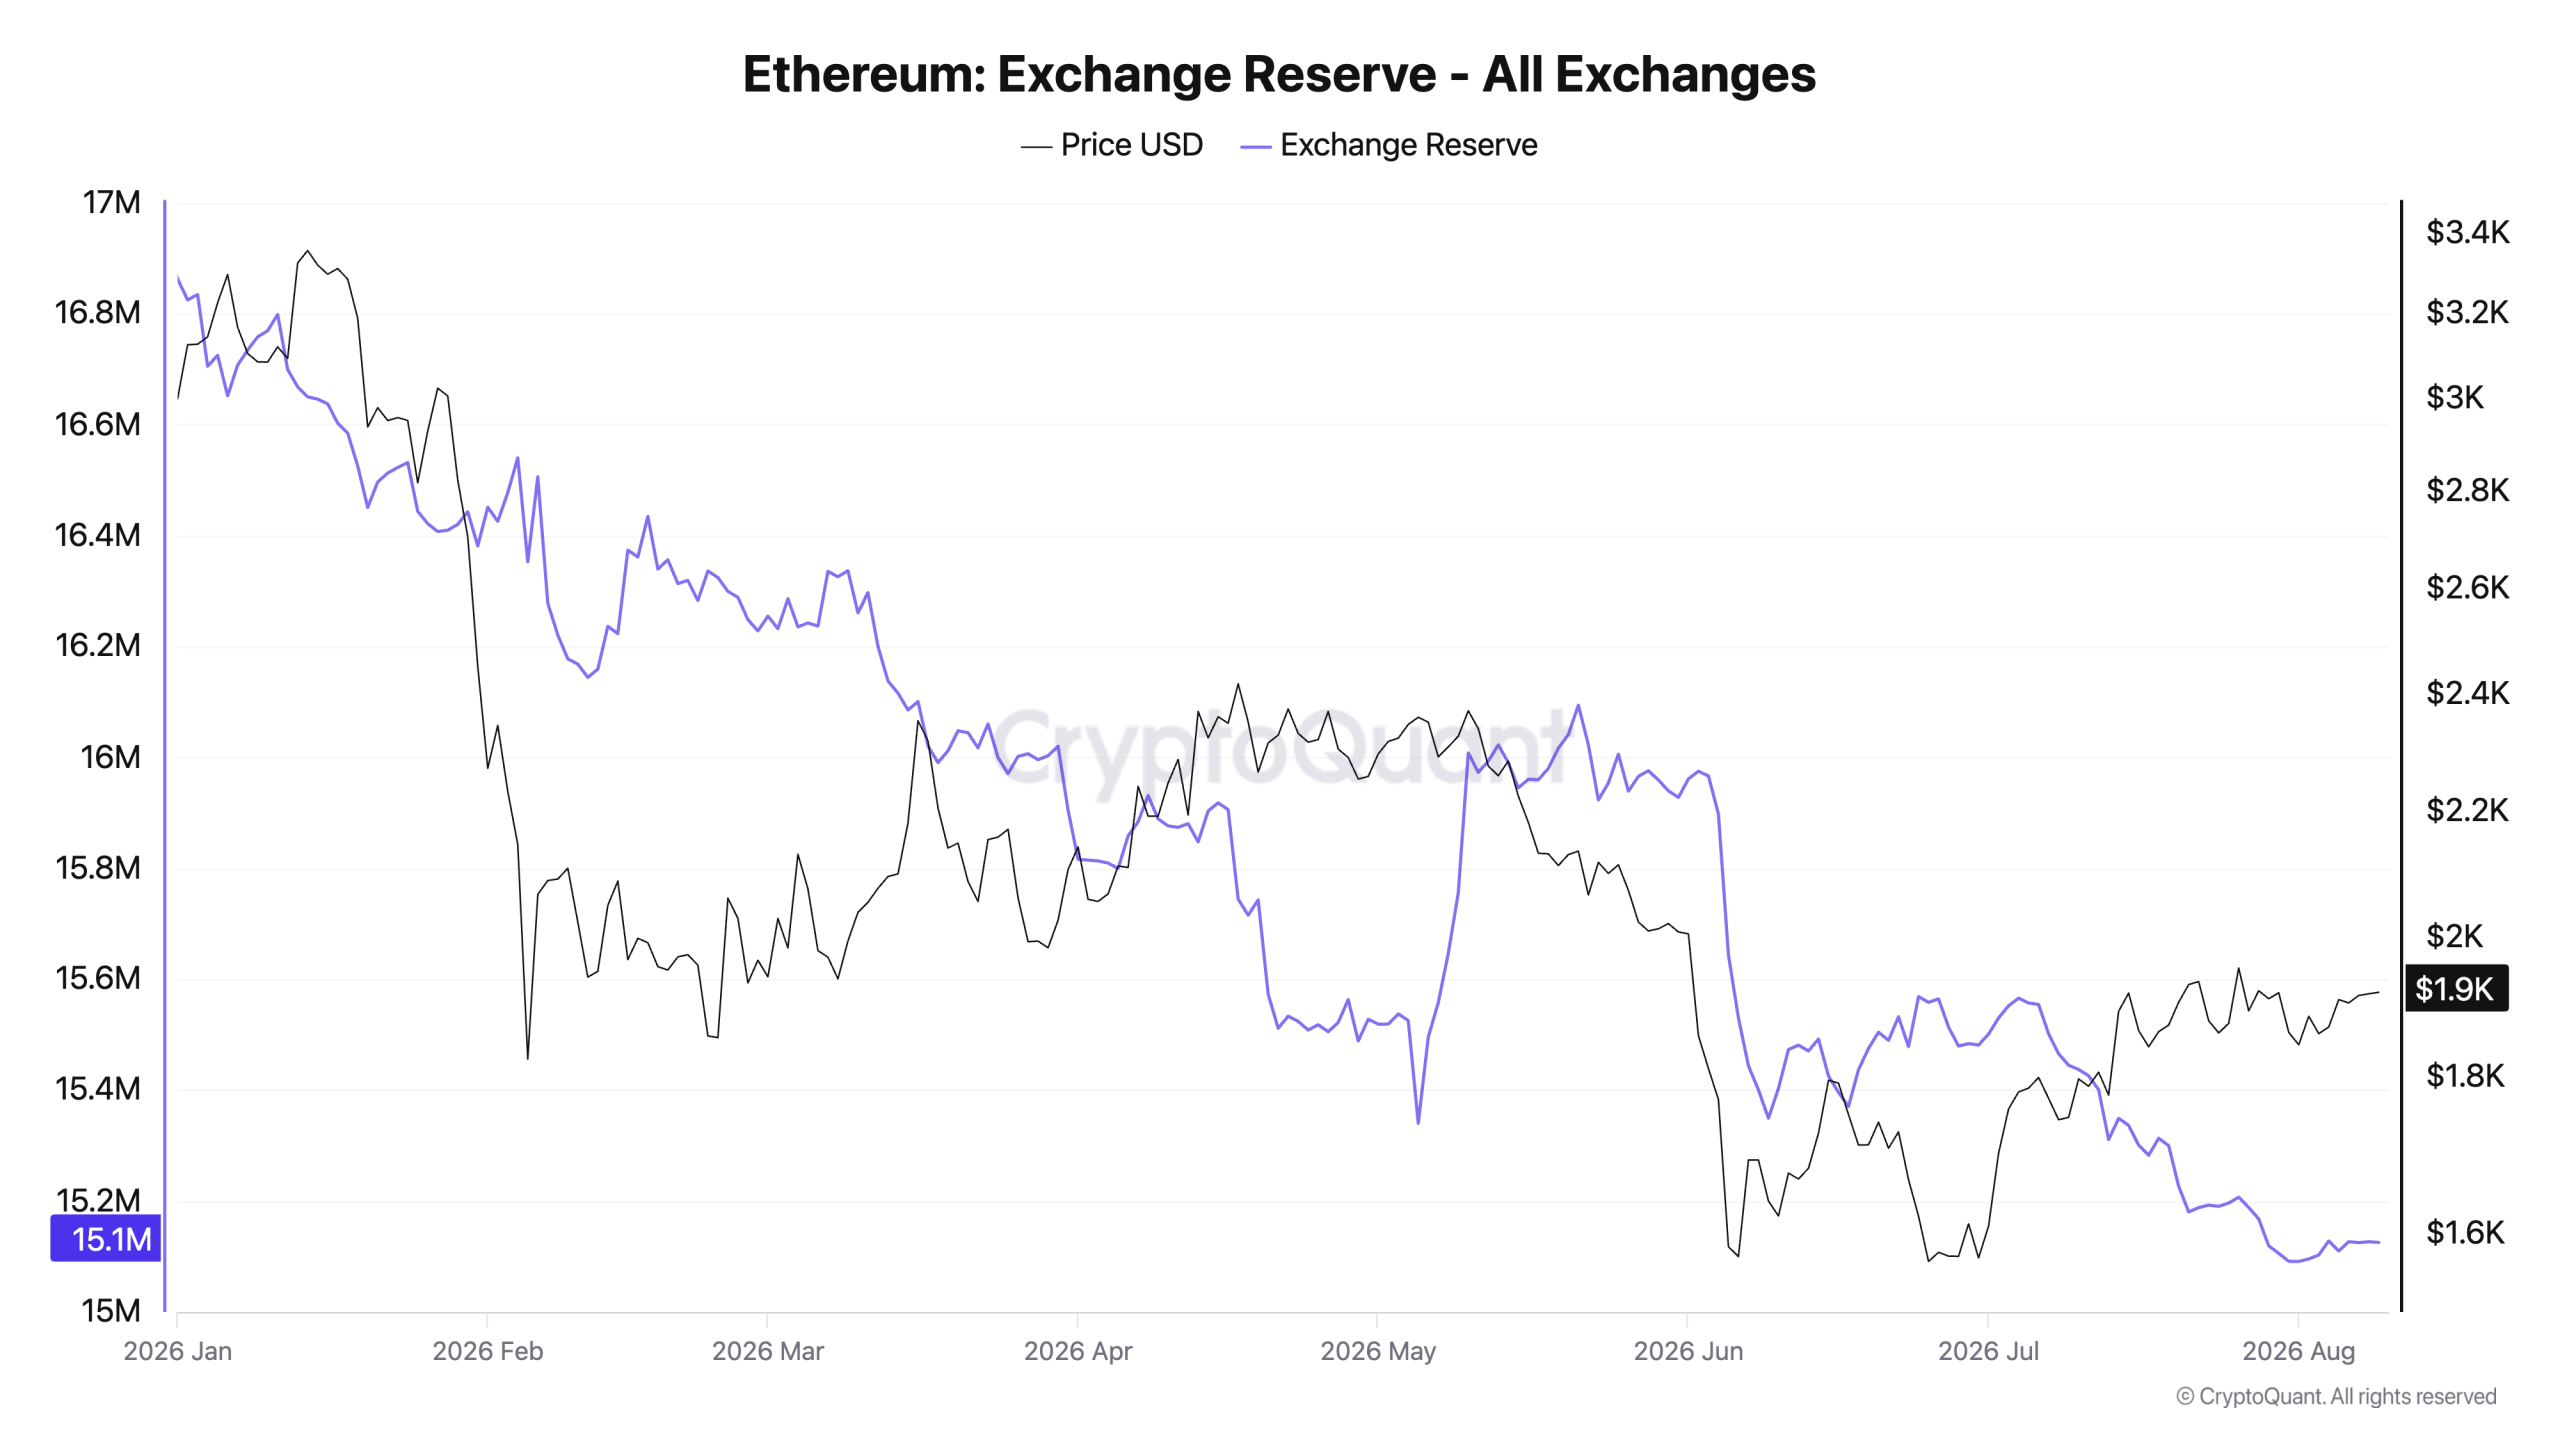
Exchange-held Ethereum has declined significantly during 2026. Data from CryptoQuant shows aggregate exchange reserves falling to approximately 15.12 million ETH, compared with 16.86 million ETH in January.
That represents a reduction of roughly 1.74 million ETH, or close to 10% of the supply that was previously sitting on exchanges and potentially available for sale.
Large-holder activity has not provided an obvious bearish signal either. Transfers involving the largest wallets, measured through top-10 inflow and outflow volumes, remain below their recent averages.
Staking is adding another layer to the supply constraint. More than 34% of Ethereum’s circulating supply is now staked, while the validator exit queue remains close to zero. In other words, a substantial portion of holders appear comfortable keeping their ETH locked rather than returning it to liquid markets.
If you’re not bullish enough on $ETH, look at Ethereum in these four charts:
[1] Weekly transaction activity recently pushed above 20M, showing that Ethereum usage remains near historical highs.
[2] Stablecoin supply is still around $167B, keeping Ethereum one of the largest… https://t.co/m0caXx9bBx pic.twitter.com/whVDOBlEHQ
— Tanaka (@Tanaka_L2) August 8, 2026
Institutional products are contributing to the trend as well. Spot Ethereum ETFs attracted approximately $482 million during the four weeks ending August 7, including around $245 million in the final week alone. Cumulative net inflows have reached roughly $11.46 billion, according to SoSo Value.
At the same time, smart-contract deployment has accelerated, pointing to stronger activity across Ethereum’s network.
Together, these developments suggest a widening disconnect: the amount of readily available ETH is shrinking while activity and demand for Ethereum’s infrastructure are increasing.
Network Activity Adds to the Picture
Independent onchain data provides another piece of the puzzle.
Analyst Tanaka pointed to weekly Ethereum transaction activity exceeding 20 million, a level close to historical highs.
Historically, periods in which exchange liquidity contracts while network activity expands have sometimes preceded larger price movements once demand establishes a clear direction.
However, that pattern should not be interpreted as a timing indicator. Reduced liquid supply can make a market more sensitive to demand, but it does not guarantee that prices will rise immediately.
Stablecoin Liquidity Is Moving Toward Ethereum
The liquidity picture is also changing beneath the surface.
CryptoOnchain reported that Binance’s average daily stablecoin netflows over the previous 14 days were around $87 million. More notable than the overall flow, however, was the change in where that liquidity was concentrated.
USDT on Tron has declined rapidly. Binance’s Tron-based USDT reserves dropped from approximately $1.4 billion to around $709 million over a period of roughly two weeks.
Ethereum-based stablecoin liquidity moved in the opposite direction.
USDT flows on Ethereum increased by 210% week over week, while USDC inflows rose 114% during the same period.
That does not necessarily indicate that capital is exiting crypto. Instead, it may indicate that liquidity is being repositioned between networks, with Ethereum attracting a greater share of stablecoin capital.
One possible explanation is that market makers and larger participants are moving collateral toward Ethereum because of its deeper DeFi ecosystem, broader market infrastructure, or expectations of increased volatility involving ETH.
The Missing Ingredient: Stronger Demand
Despite the increasingly tight supply picture, Ethereum has yet to produce the breakout many traders are watching for.
ETF inflows have remained positive in recent weeks, but ETH’s price response has been limited. This could mean that additional supply is absorbing incoming demand, or simply that buyers have not yet shown enough conviction to push the market through resistance.
US spot demand also remains relatively subdued.
$ETH is still hovering around the $1,900 level.
ETFs are buying, which shows institutional demand.
If Ethereum holds above $1,900, I can see it rallying above $2,000 soon. pic.twitter.com/L7lIvURcYM
— Ted (@TedPillows) August 8, 2026
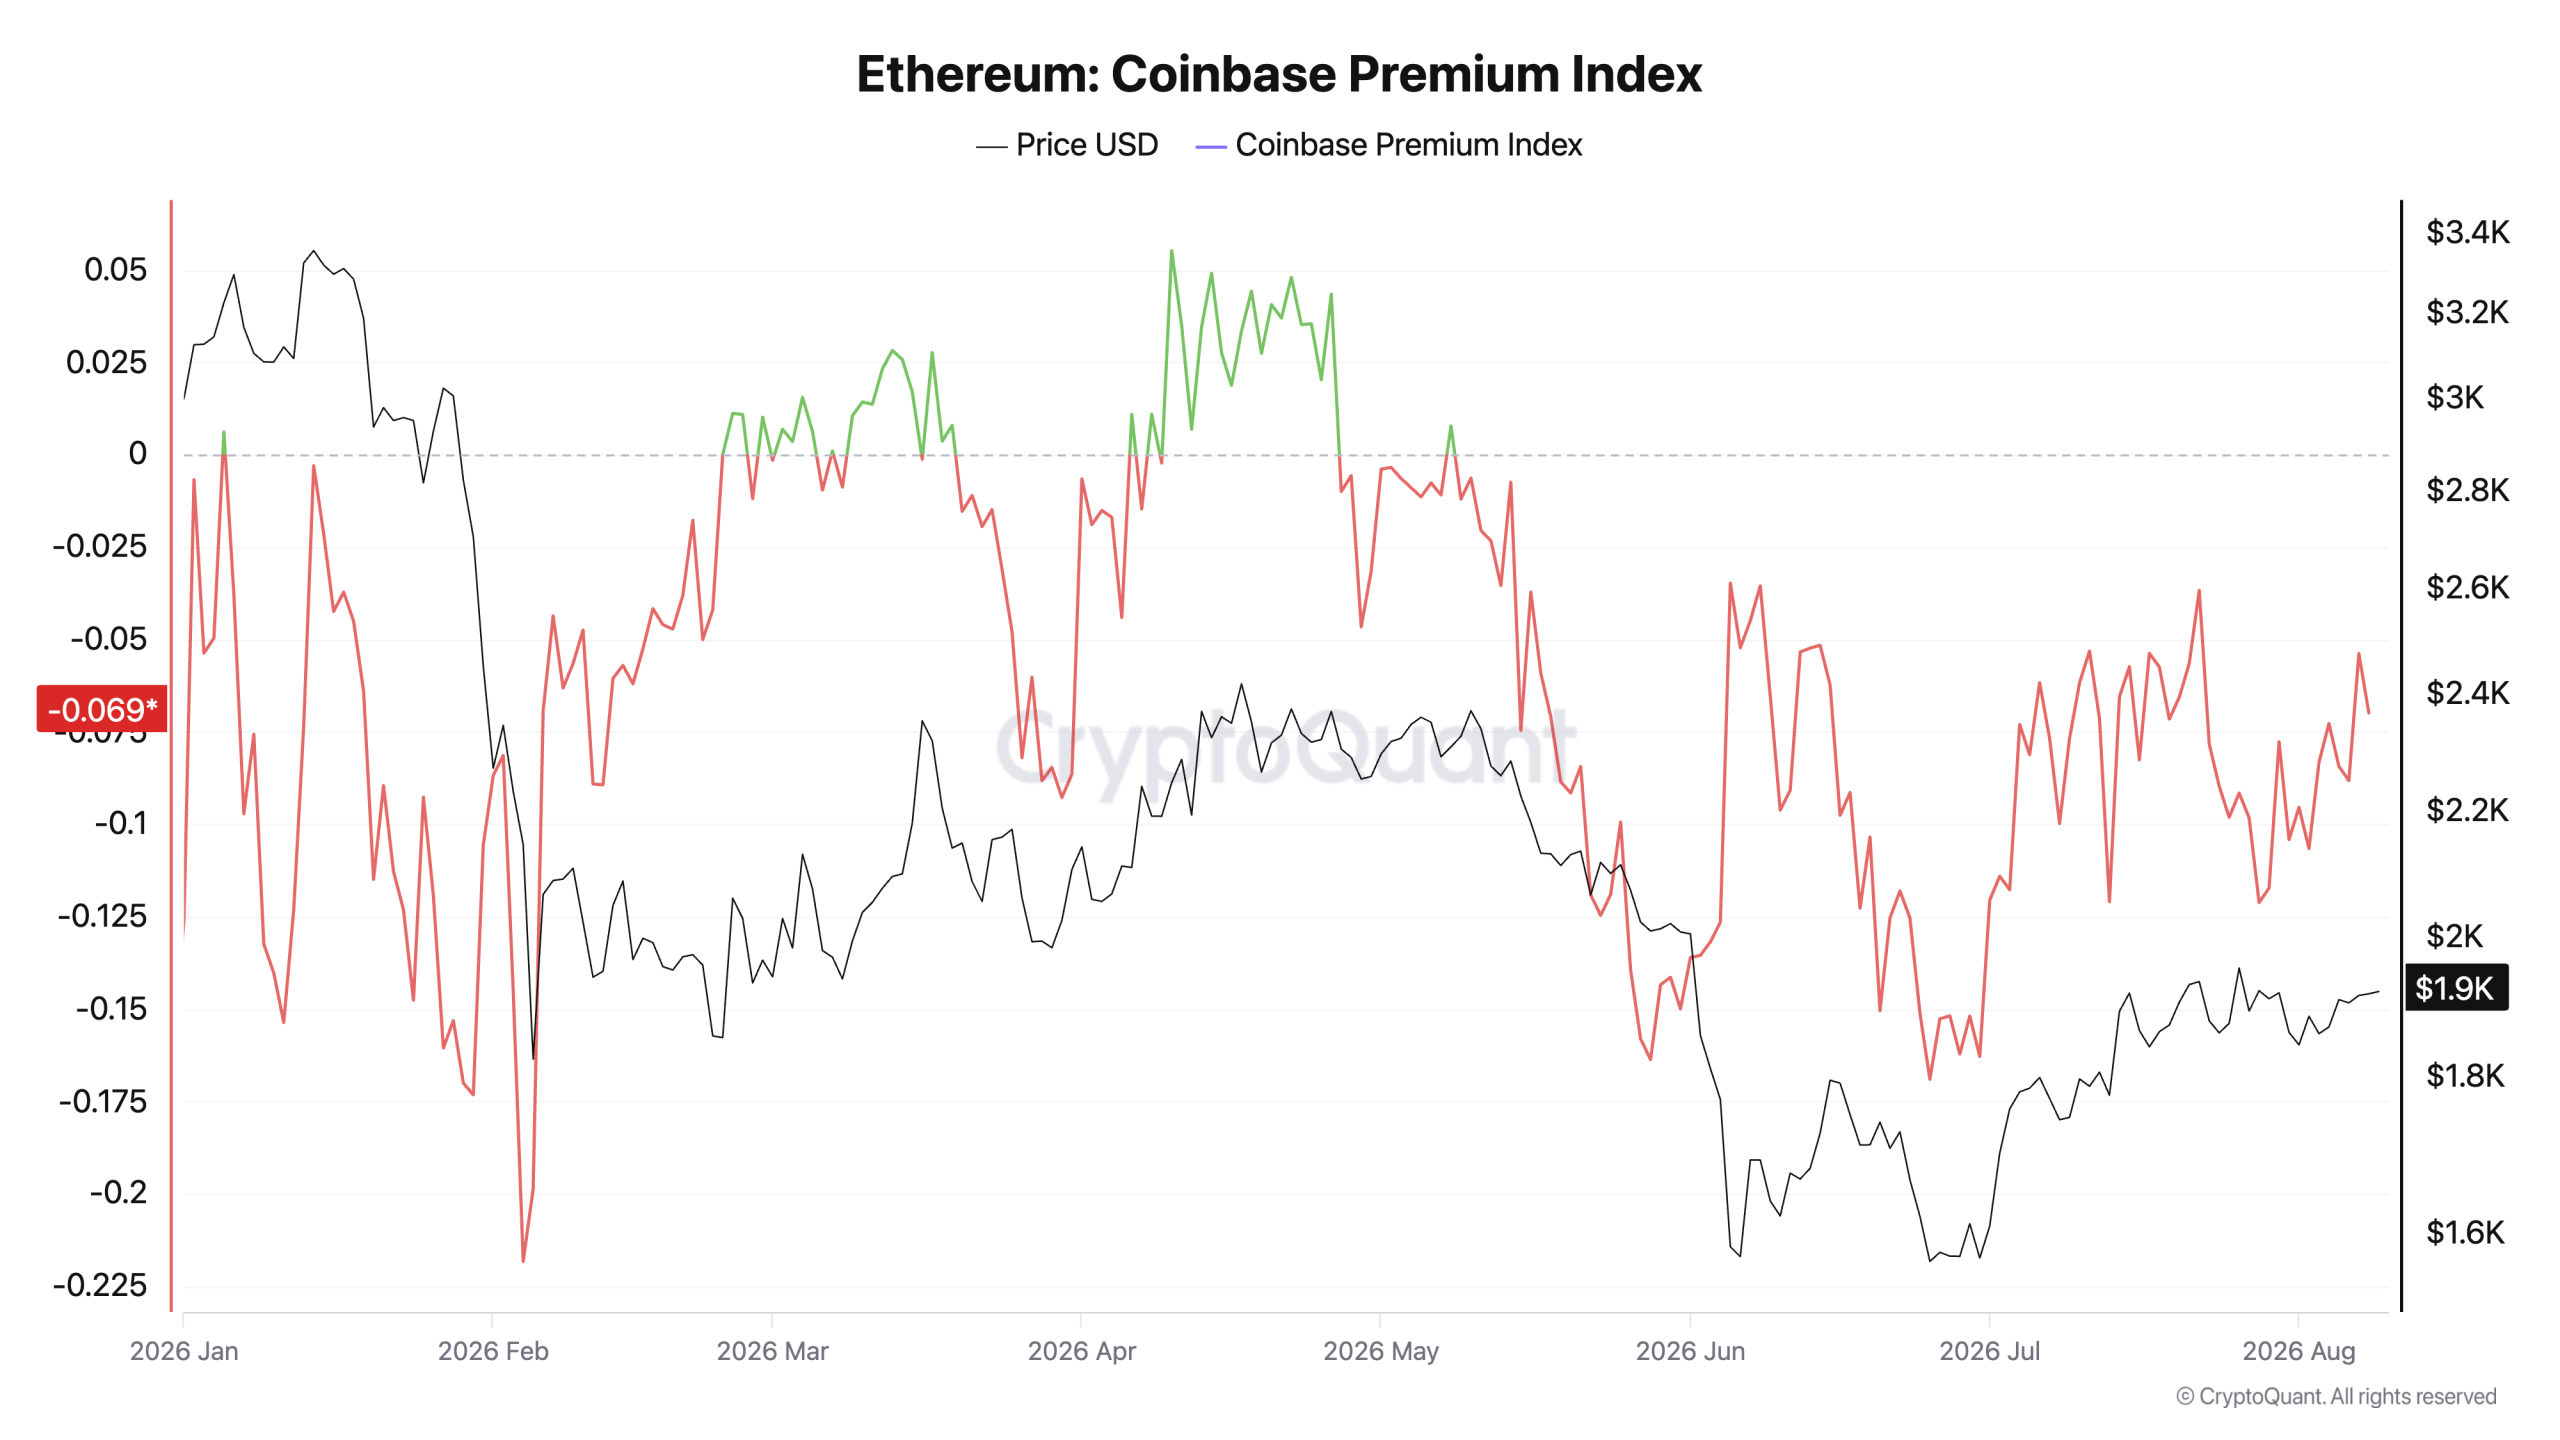
The Coinbase Premium Index, which compares Coinbase spot prices with offshore markets, has remained negative since early May and is currently around -0.069. A persistent negative reading suggests that US-based spot buying has not yet become a major source of upward pressure.
Meanwhile, analyst Michaël van de Poppe has characterized ETH as trapped within a broad $1,800-$2,000 range, with volatility sitting near multi-year lows.
A sustained move above $2,000 could therefore become an important technical development. If it occurs alongside stronger spot demand, the current supply dynamics could potentially amplify the resulting move.
Ethereum Is Tightening — But the Market Still Needs a Catalyst
The current Ethereum setup is less about an immediate bullish signal and more about changing market structure.
Exchange balances are falling. Staking is absorbing a larger share of circulating ETH. ETF products continue to attract capital. Stablecoin liquidity is increasingly flowing through Ethereum, while network activity remains elevated.
But none of those factors automatically produces a rally.
For ETH to break out of its current range, the market still needs a clear increase in demand. Until that happens, Ethereum can remain in this unusual state: progressively tighter liquid supply beneath a relatively stagnant price.
The longer that imbalance persists, the more closely traders are likely to watch the point at which demand finally overwhelms the available supply.
