


Chainlink (LINK) has pulled back after briefly moving above $15 in late September, returning to the $13 range. Despite the recent weakness, its broader price structure remains constructive, with higher lows forming since August. Traders are now watching whether LINK can overcome resistance near $15, while a longer-term chart pattern has raised the possibility of a much larger move.
LINK Buyers Defend Support as $15 Remains the Key Level
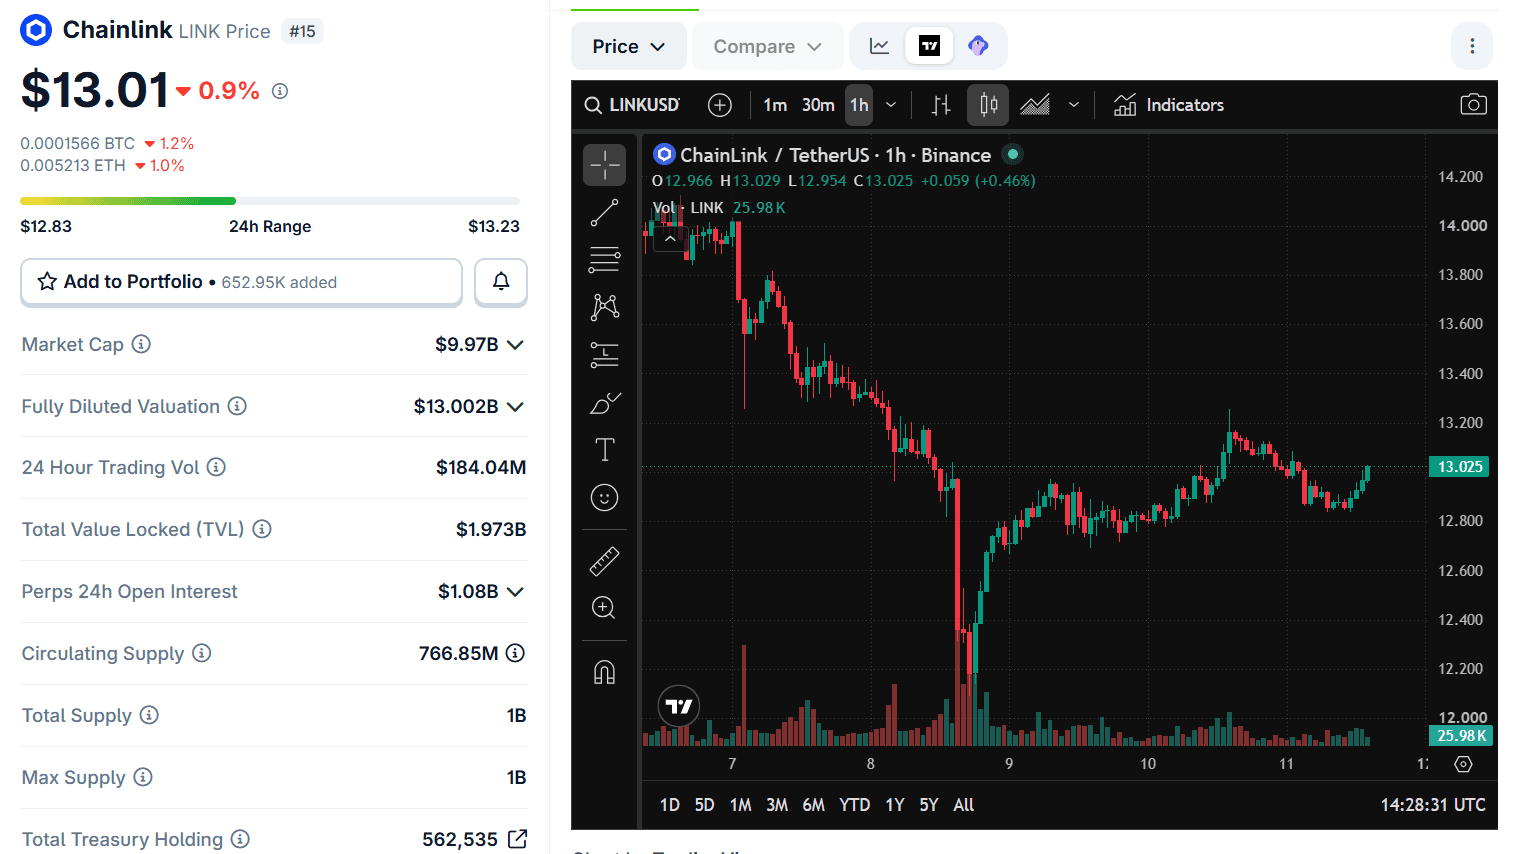
On October 6, LINK traded around $13.86, reaching an intraday high of approximately $13.92. Although short-term momentum has slowed, the recovery from around $8 in August has changed the chart’s overall structure.
Investors flocking to buy Chainlink exposure.
Spot @Chainlink ETFs just saw their best week since August, soaking up +$8.3M in the past five trading days.
Impressively, spot $LINK ETFs have seen just two single days of net outflows since launching last year, and only one week… pic.twitter.com/kVM62qjnsk
— BSCN (@BSCNews) October 4, 2026
Since that low, buyers have repeatedly stepped in during pullbacks, helping LINK establish progressively higher lows. The token has also moved above the $10–$11 range, which previously acted as a major barrier.
The next test lies between $14.50 and $15. A sustained daily close above this zone could strengthen the bullish outlook and open the door to a potential move toward $16.
On the downside, the low-$13 range remains an important area to watch. LINK’s rising trend line from August has continued to provide support during retracements. If that support fails, the $10.30–$10.80 region could become relevant again, as buyers previously defended this area before the latest recovery.
A Multi-Year Triangle Could Shape LINK’s Longer-Term Outlook
Beyond its immediate price levels, Chainlink’s long-term chart structure has attracted attention. A triangle pattern spanning roughly five years could point to a significant price expansion if LINK eventually breaks above its upper boundary.
However, the pattern alone does not guarantee a rally. Confirmation would depend on how price responds to resistance and whether a breakout holds.
Chainlink’s continued infrastructure development may also influence its longer-term outlook. The project has introduced CCIP 2.0, which focuses on cross-chain communication and includes cross-chain verifiers designed to provide additional verification options for institutional transfers. Faster-than-finality transfers also offer more flexibility around transaction speed and confirmation preferences.
Its ecosystem has continued to expand. Chainlink Data Feeds have launched on Stellar, while Arc mainnet added CCIP support in September. These developments extend the network’s reach across blockchain infrastructure and cross-chain applications.
Chainlink ETF Inflows Add Another Metric to Watch
Institutional investment provides another data point for LINK observers. According to the figures cited in the original report, Bitwise’s U.S. Chainlink ETF accumulated about $47 million in net inflows, including about $14 million over the preceding month.
The report also indicated that the fund recorded no days with net outflows during that period. Combined assets across two tracked U.S. Chainlink funds reportedly reached about $235 million as of October 5, representing approximately 17 million LINK.
These figures may indicate sustained investor interest, although ETF flows alone cannot predict future price performance.
For now, LINK’s outlook depends on several factors: whether buyers can defend support near $13, whether the token can reclaim $15, and whether the longer-term triangle eventually produces a confirmed breakout. A move above resistance could strengthen the bullish case, while a loss of support would weaken it.
