


Bitcoin delivered a powerful performance in August, climbing 24.95%. Even after that rally, however, BTC remains 9.62% below its opening price for the year.
The August advance appears to have been driven primarily by institutional fund flows. While funds accumulated Bitcoin aggressively, other market participants were largely using the rally as an opportunity to sell.
That creates an important question heading into September: can institutional demand continue to absorb available supply, or does the market now face a period of consolidation and downside pressure?
ETF Demand Reversed the Year’s Trend
August’s fund inflows were significant enough to reshape the broader picture for 2026.
Between January and July, these same funds recorded cumulative net outflows of approximately $5.30 billion. August’s $3.5 billion buying wave did not merely outperform previous months; it substantially reversed the direction of the year’s institutional flow trend.
The concern for Bitcoin bulls is what has historically happened after similarly strong periods of fund demand.
Could Bitcoin Decline in September 2026?
Since the launch of these funds, there have been 12 months in which net inflows exceeded $3 billion. Bitcoin declined in the following month after seven of those occasions.
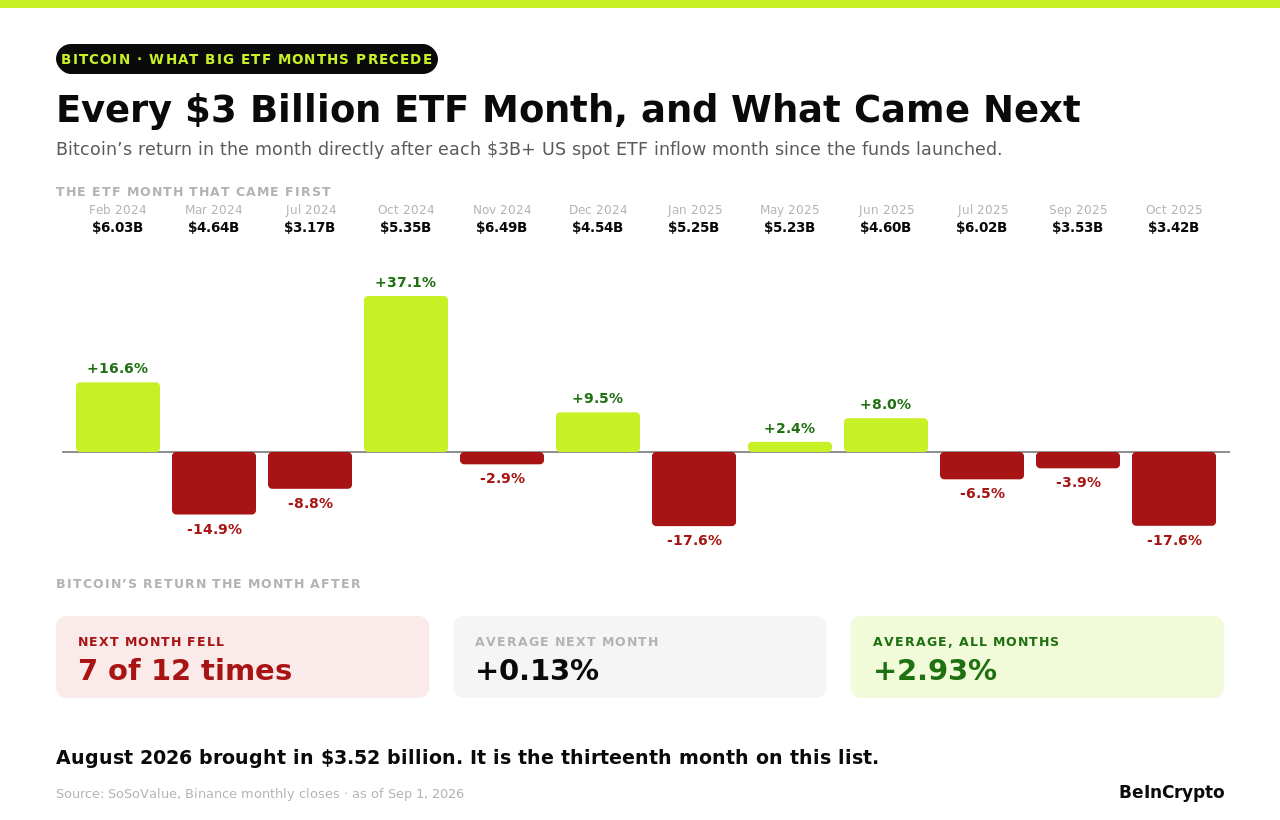
Historically, the average return in those post-inflow months has been just 0.13%, compared with an average monthly return of 2.93%.
Seasonal trends also provide a reason for caution. Before 2026, Bitcoin had recorded only two positive August closes since 2020. On both occasions, September followed with declines of 7.30% and 7.96%.
However, the bearish seasonal argument is not as straightforward as it once was.
Bitcoin has finished higher in each of the last three Septembers, suggesting that its long-standing reputation for weakness during the month may no longer be as reliable as historical averages suggest.
Long-Term Holders Sold Into the Rally
On-chain data indicates that long-term Bitcoin holders were distributing coins throughout much of August.
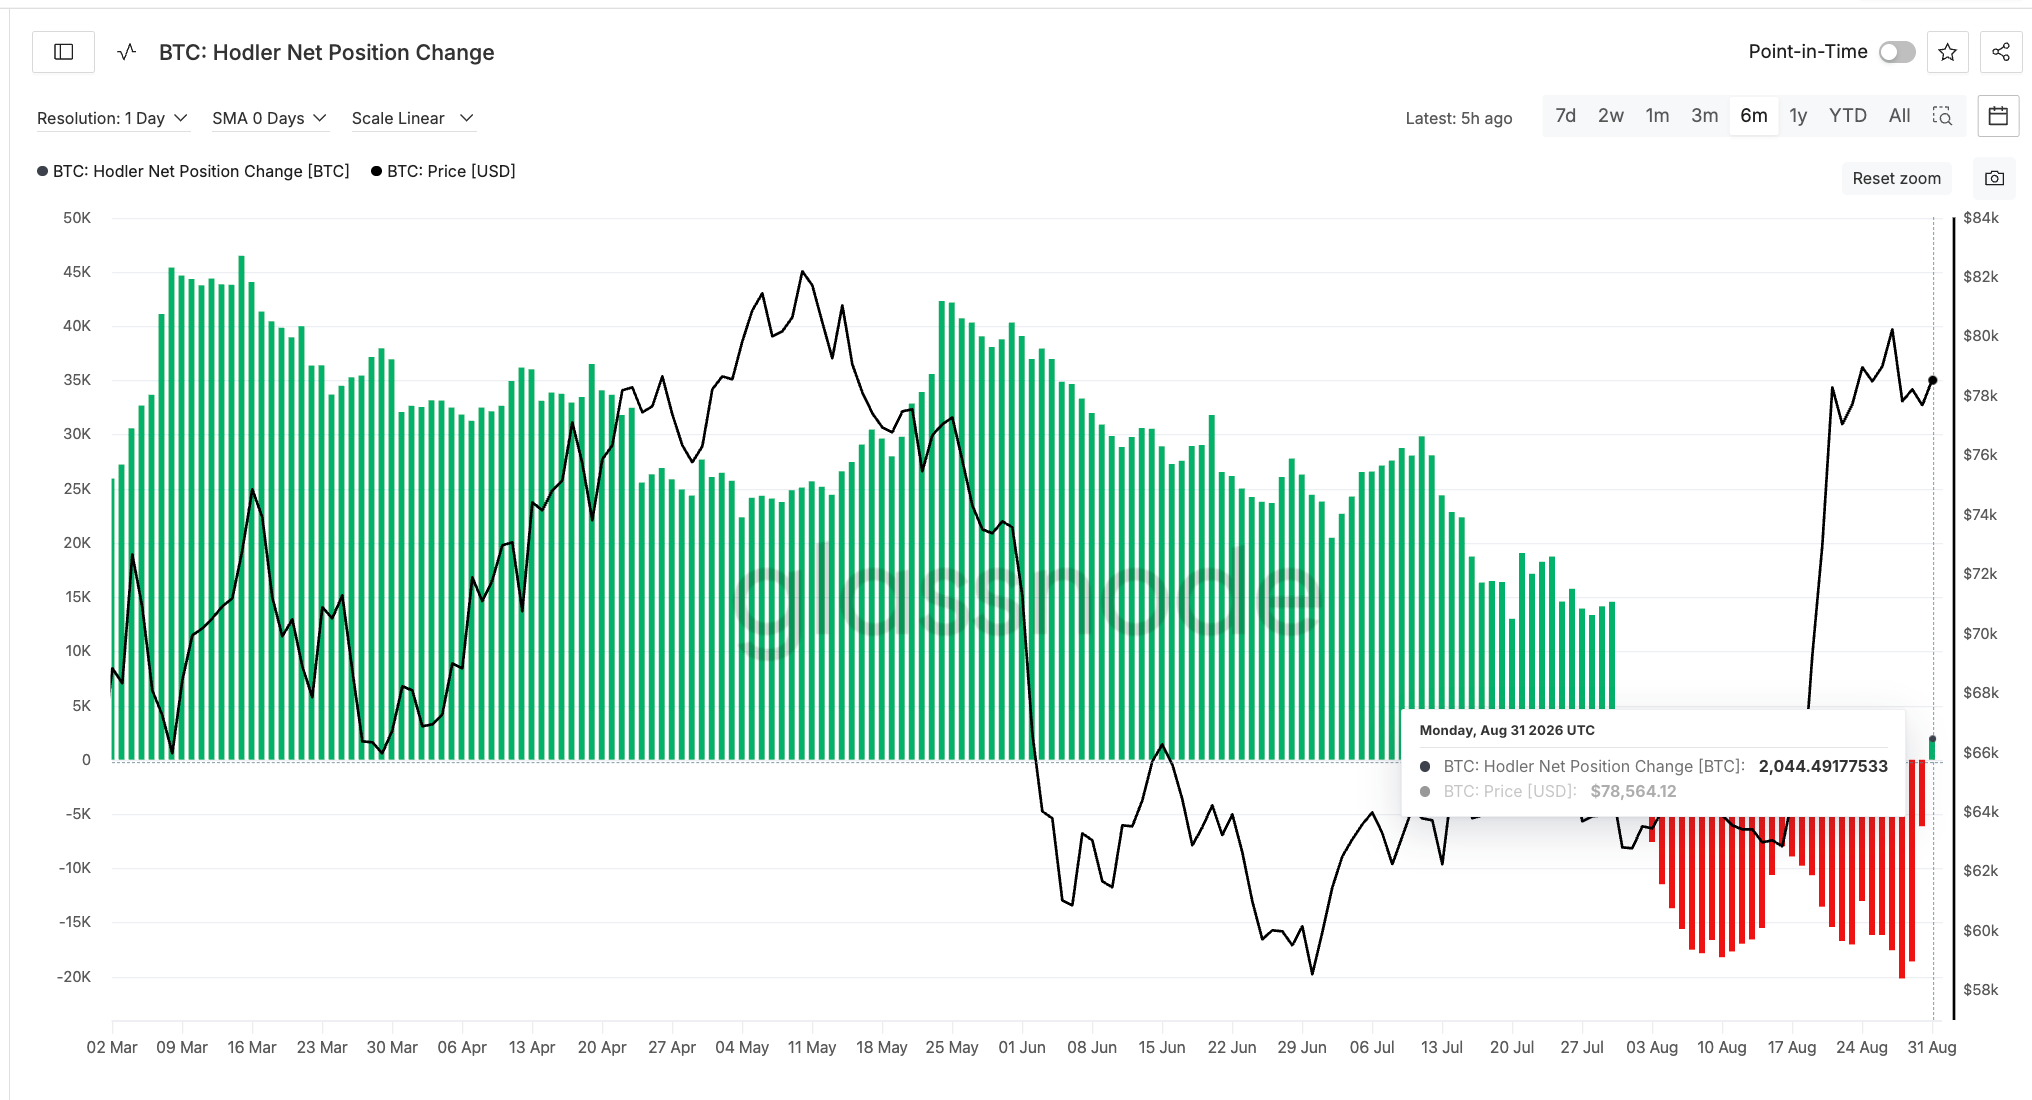
The Hodler Net Position Change indicator, which tracks whether long-term investors are accumulating or reducing their holdings, remained negative during the rally. It turned negative on August 2 and stayed there for approximately four weeks.
The trend finally changed at the end of the month.
On August 31, the indicator printed its first positive reading since July, showing an increase of 2,044 BTC.
Large holders followed a similar pattern, although their numbers had not yet recovered. The number of wallets holding more than BTC declined from 1,963 on July 31 to 1,908—a reduction of 55 large wallets during a month in which Bitcoin gained almost 25%.
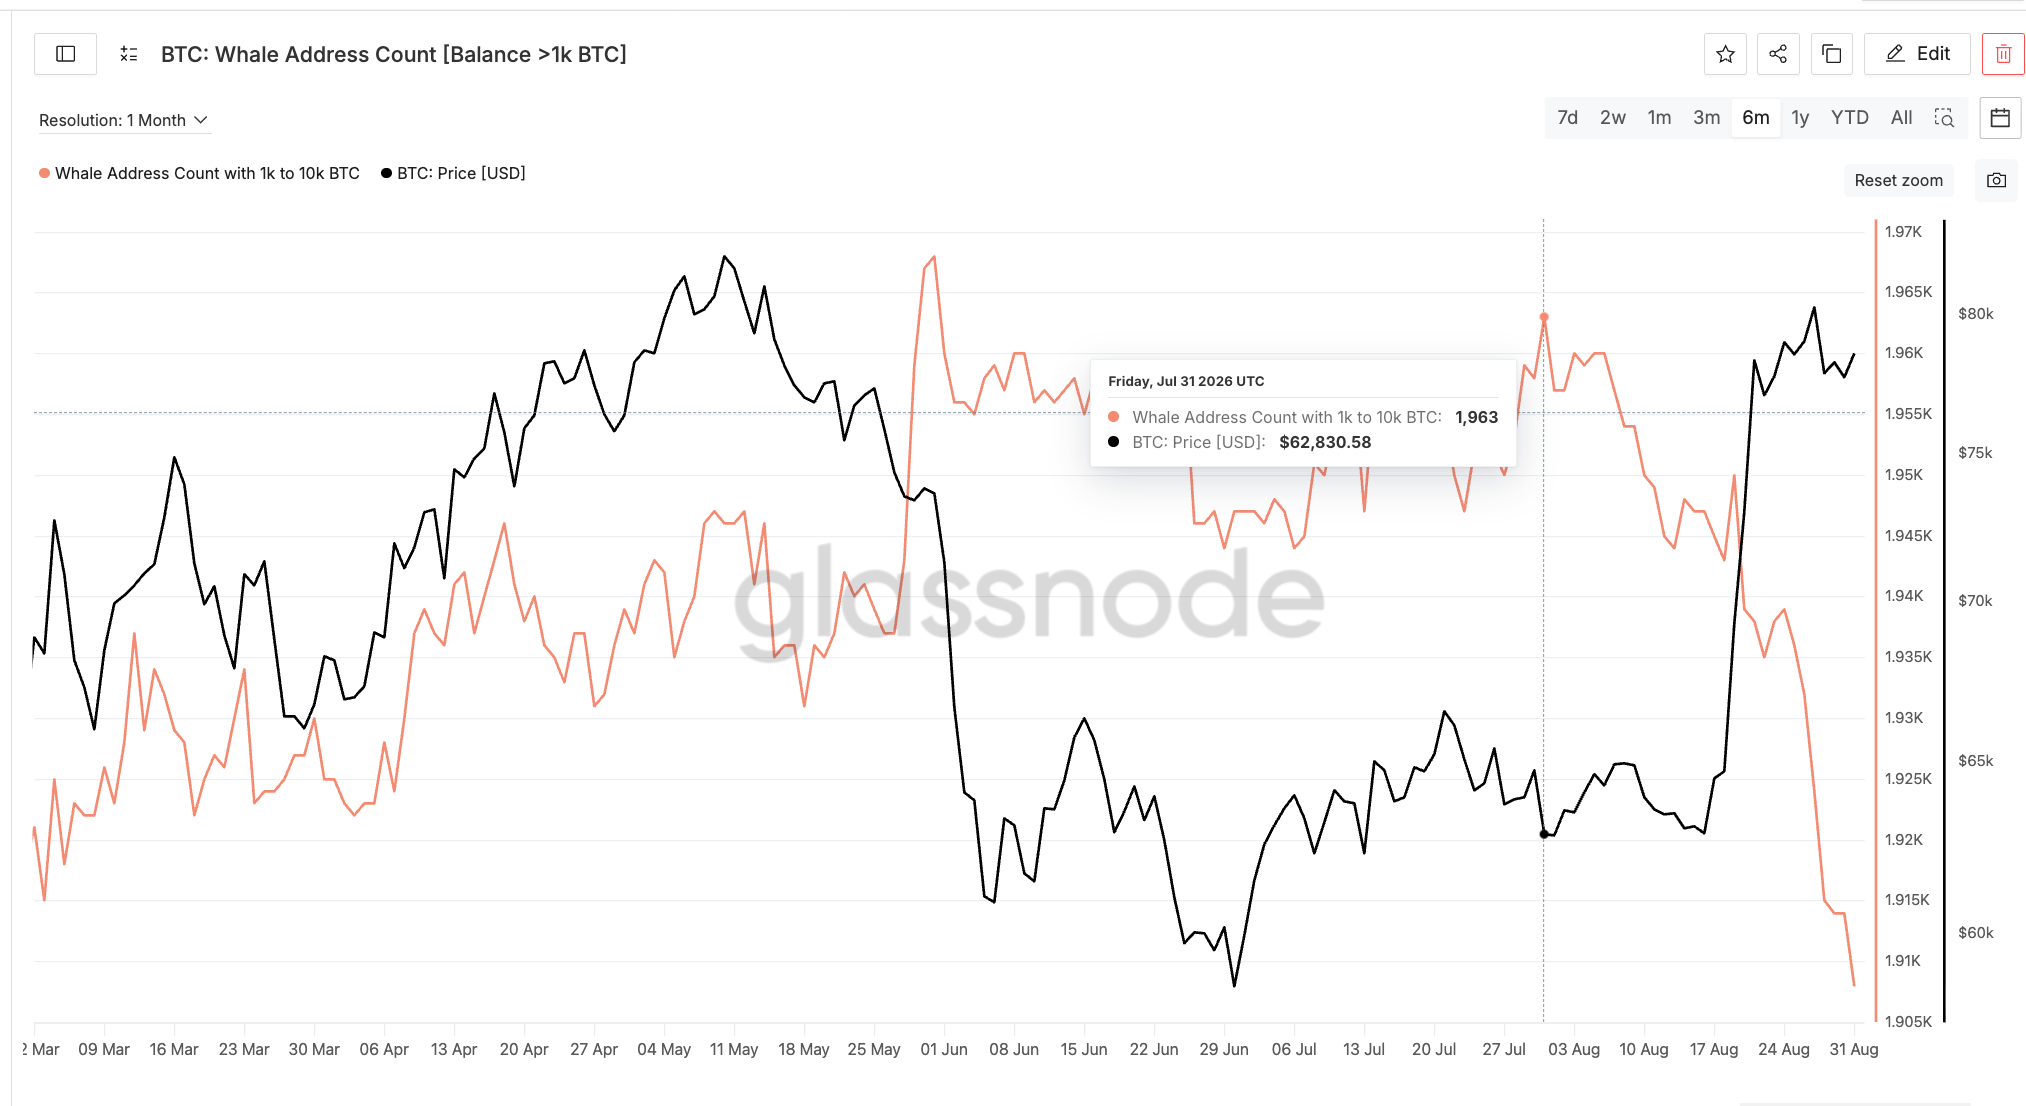
In other words, institutional buyers appear to have been absorbing supply released by long-term holders and whales.
That distinction matters because it suggests the selling pressure was related to profit-taking and supply distribution rather than a reaction to a major negative event.
Are Major Traders Still Positioned for Higher Prices?
Futures market positioning suggests that large traders remain optimistic.
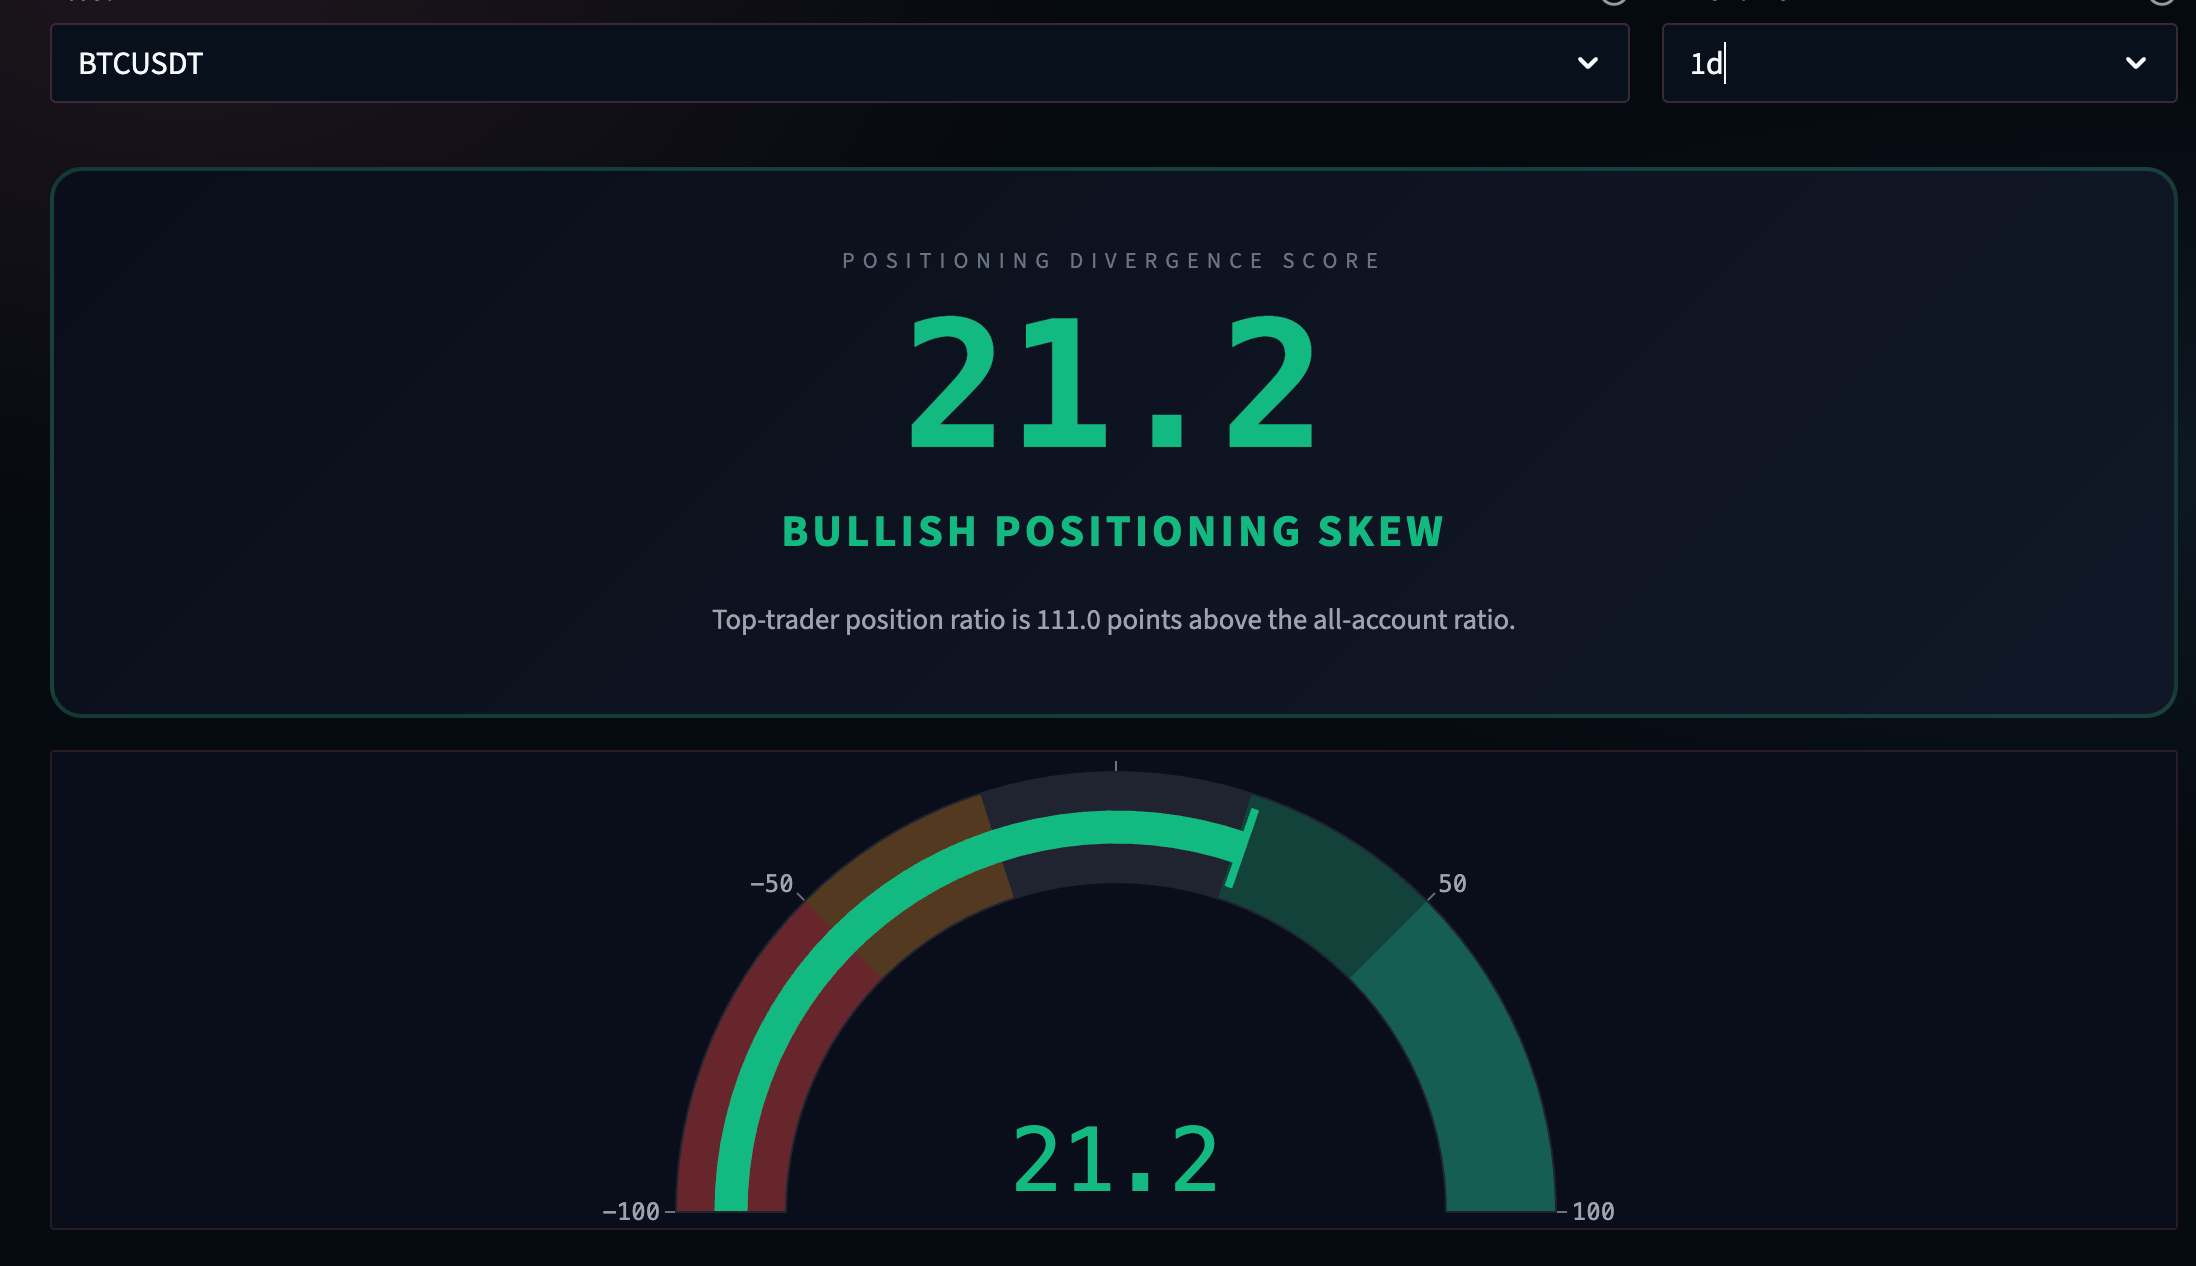
Bitcoin’s positioning divergence score stands at 21.2, indicating that top traders hold significantly greater long exposure than the average market participant. The gap amounts to roughly 111 points of additional long positioning.
The divergence is particularly notable when compared with other major cryptocurrencies. XRP, for example, has a score of just 2.7, suggesting little meaningful difference between the positioning of top traders and the broader market.
Still, aggressive bullish positioning creates its own risk.
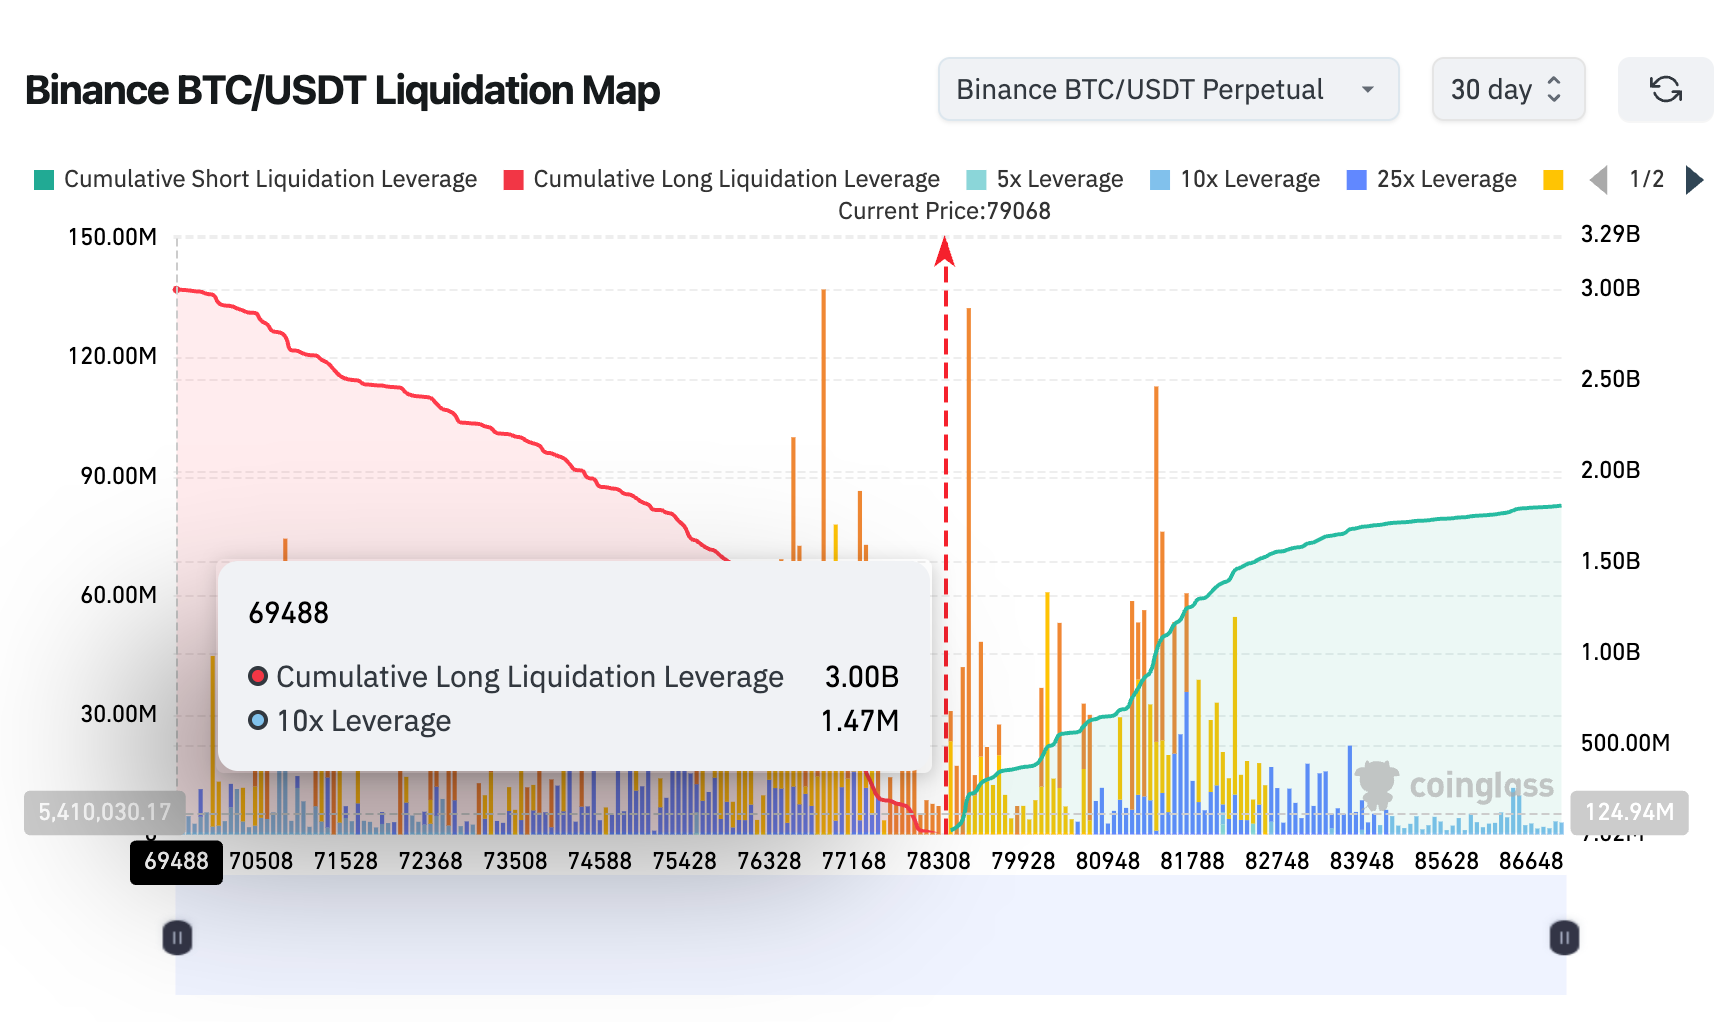
Binance reportedly has approximately $3.00 billion in long liquidation leverage below the current Bitcoin price, compared with around $1.80 billion in short liquidation leverage above it.
This imbalance means that even a relatively modest decline could trigger a wave of long liquidations, potentially accelerating downside momentum as leveraged positions are forced out of the market.
Bitcoin Price Prediction: Key Levels for September
Bitcoin is currently trading near $79,108, placing several technical levels in focus for September.
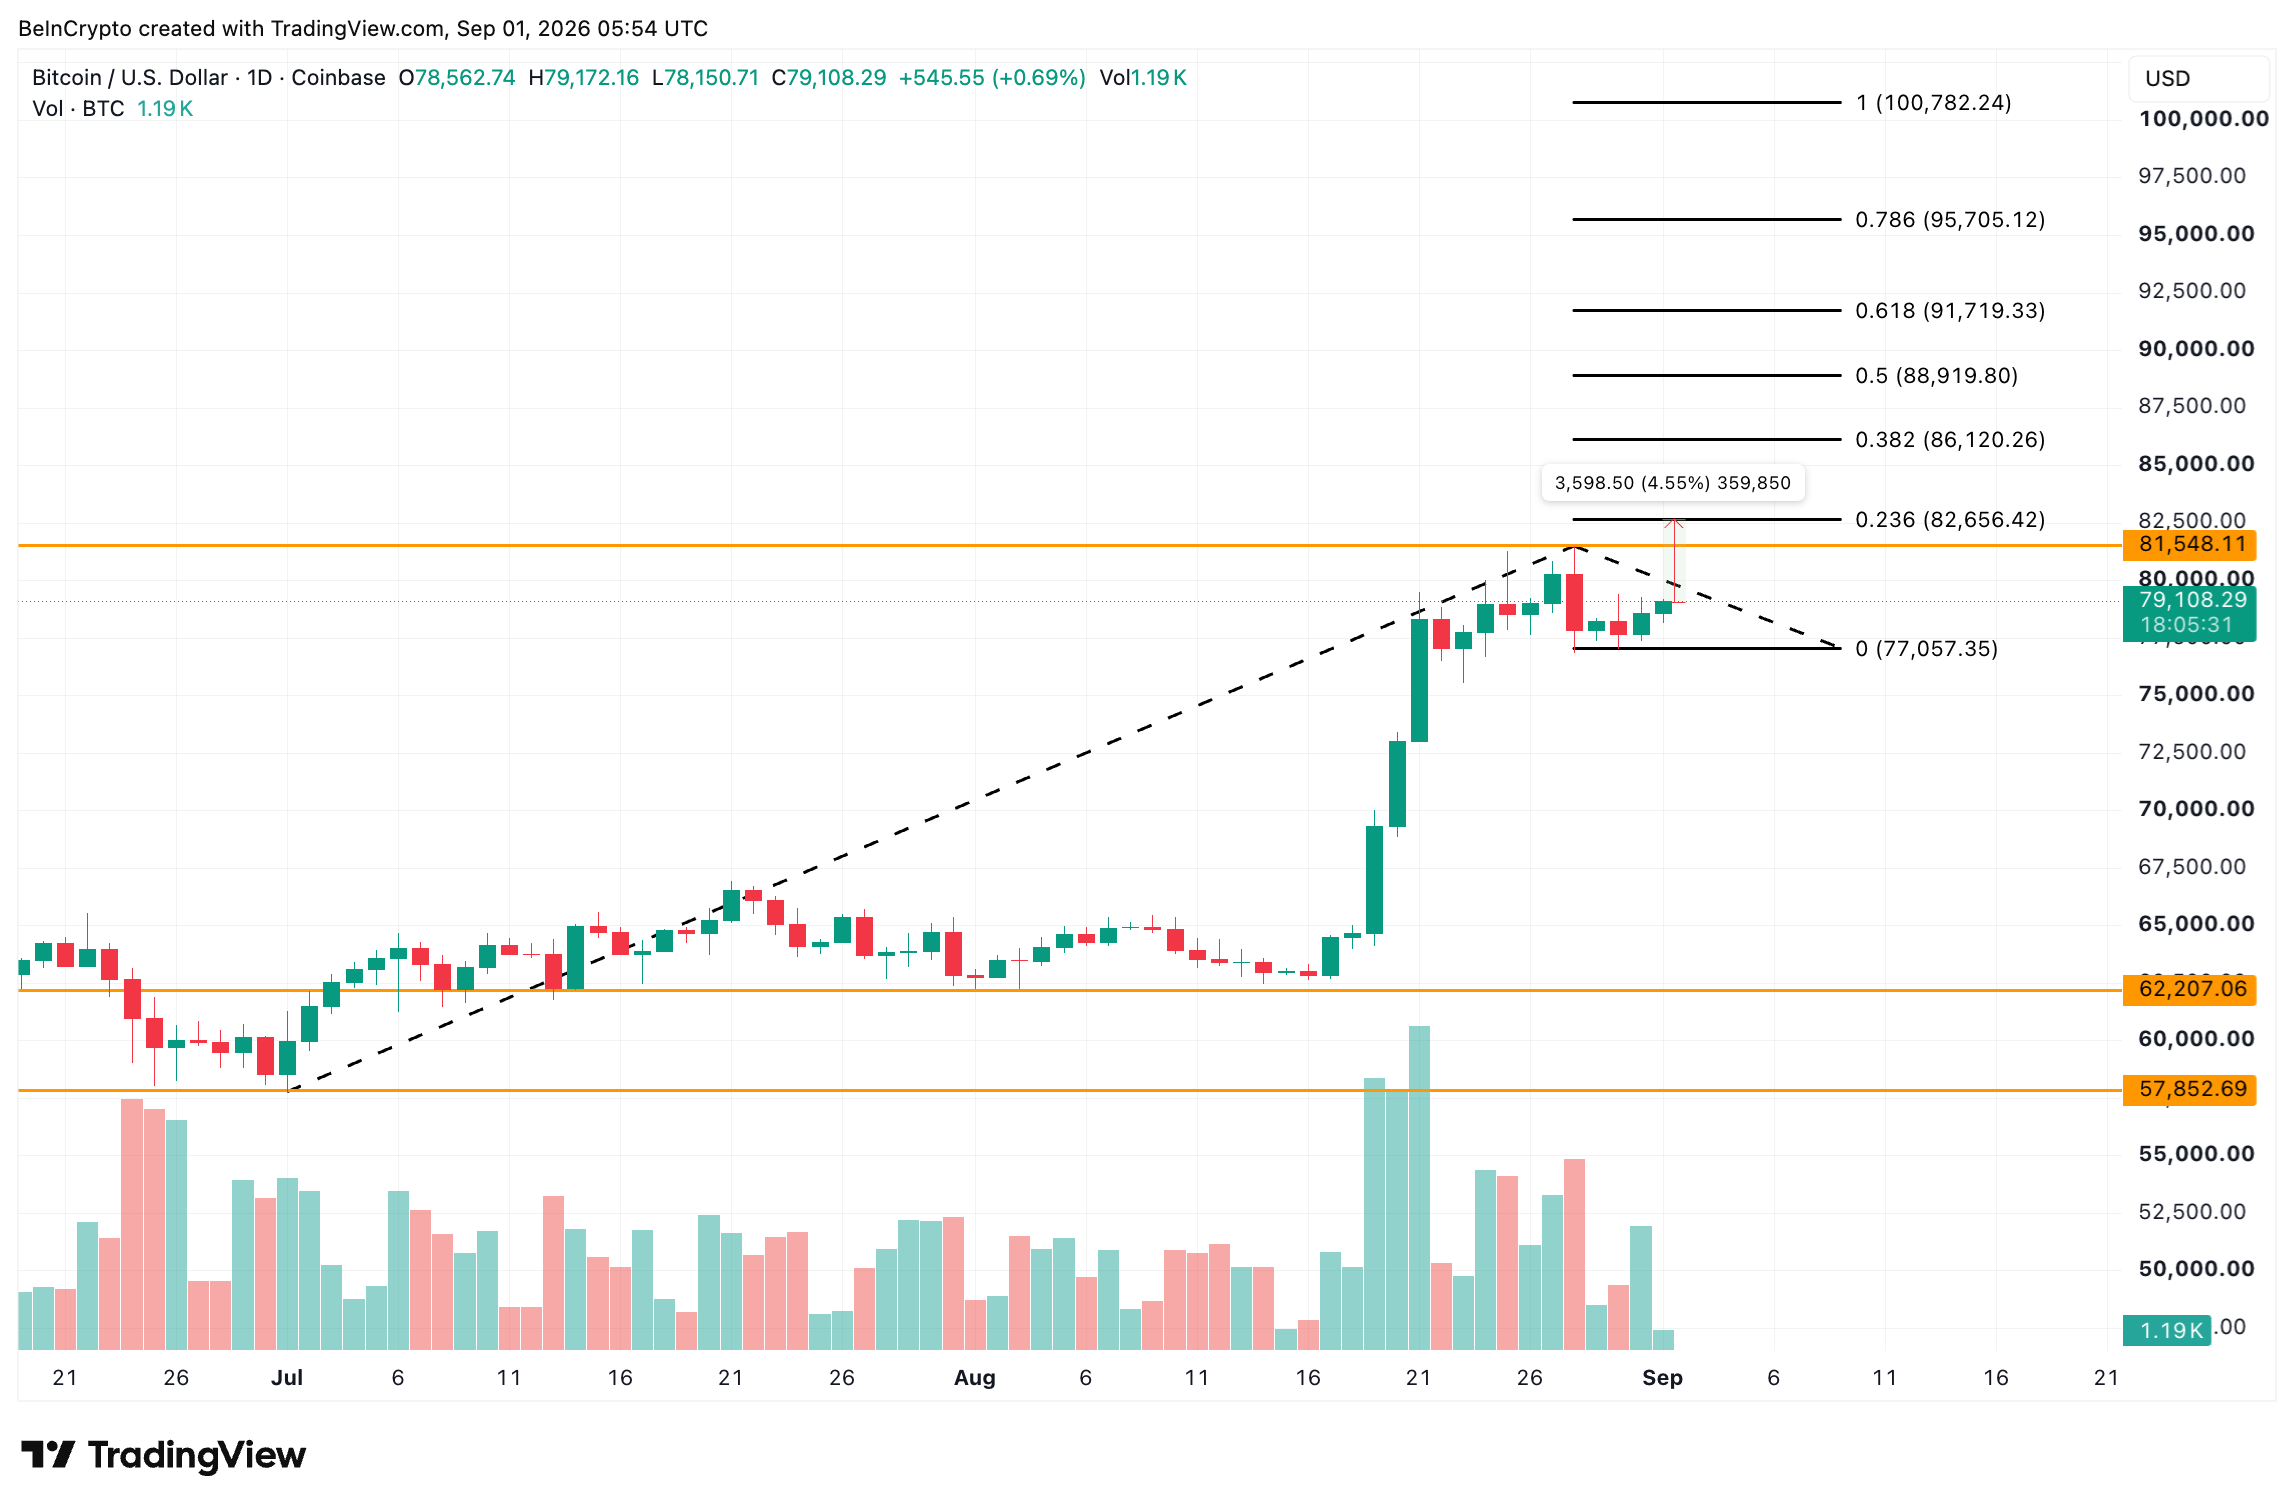
The most important support area sits near $77,057. This level has acted as the floor for the current range following the breakout. A sustained move below it could weaken the market structure and potentially expose Bitcoin to a much deeper decline toward $62,207.
On the upside, bulls need to reclaim $82,656 with a convincing daily close. Doing so could open the path toward $91,719.
A decisive move above that level would strengthen the case that Bitcoin’s broader bullish phase has resumed, with $100,782 emerging as the next major upside target.
Volume will be crucial to any bullish continuation. Buying activity only began showing signs of recovery between August 29 and August 31, meaning sustained demand will likely be needed to support another major advance.
Analyst’s View
September presents Bitcoin with a clash between historical caution and current bullish positioning.
On one side, history suggests that exceptionally strong ETF inflow months have often been followed by weaker Bitcoin performance. Seasonal data also continues to warn that September can be a difficult month for BTC.
On the other side, long-term holders showed signs of ending their distribution at the close of August, while major futures traders remain heavily positioned for higher prices.
The direction of Bitcoin in September may ultimately depend on which force becomes dominant: the historical tendency toward post-rally weakness or the renewed institutional and trader confidence supporting the current bullish structure.
