


Solana (SOL) continues to face selling pressure after recording another monthly decline, marking ten consecutive months of negative closes. The prolonged downturn has weighed heavily on investor sentiment, with the token remaining well below the highs reached earlier in the market cycle.
From a technical standpoint, July ended with a modest monthly loss, reinforcing the bearish trend that has persisted since last year’s breakdown. The inability to produce a meaningful monthly recovery has left long-term holders waiting for signs of renewed strength. As a result, the area around $60 is increasingly viewed as a major long-term support zone that could determine Solana’s next directional move.
Network Fundamentals Continue to Improve
Despite the weak price action, Solana’s underlying network metrics paint a much healthier picture.
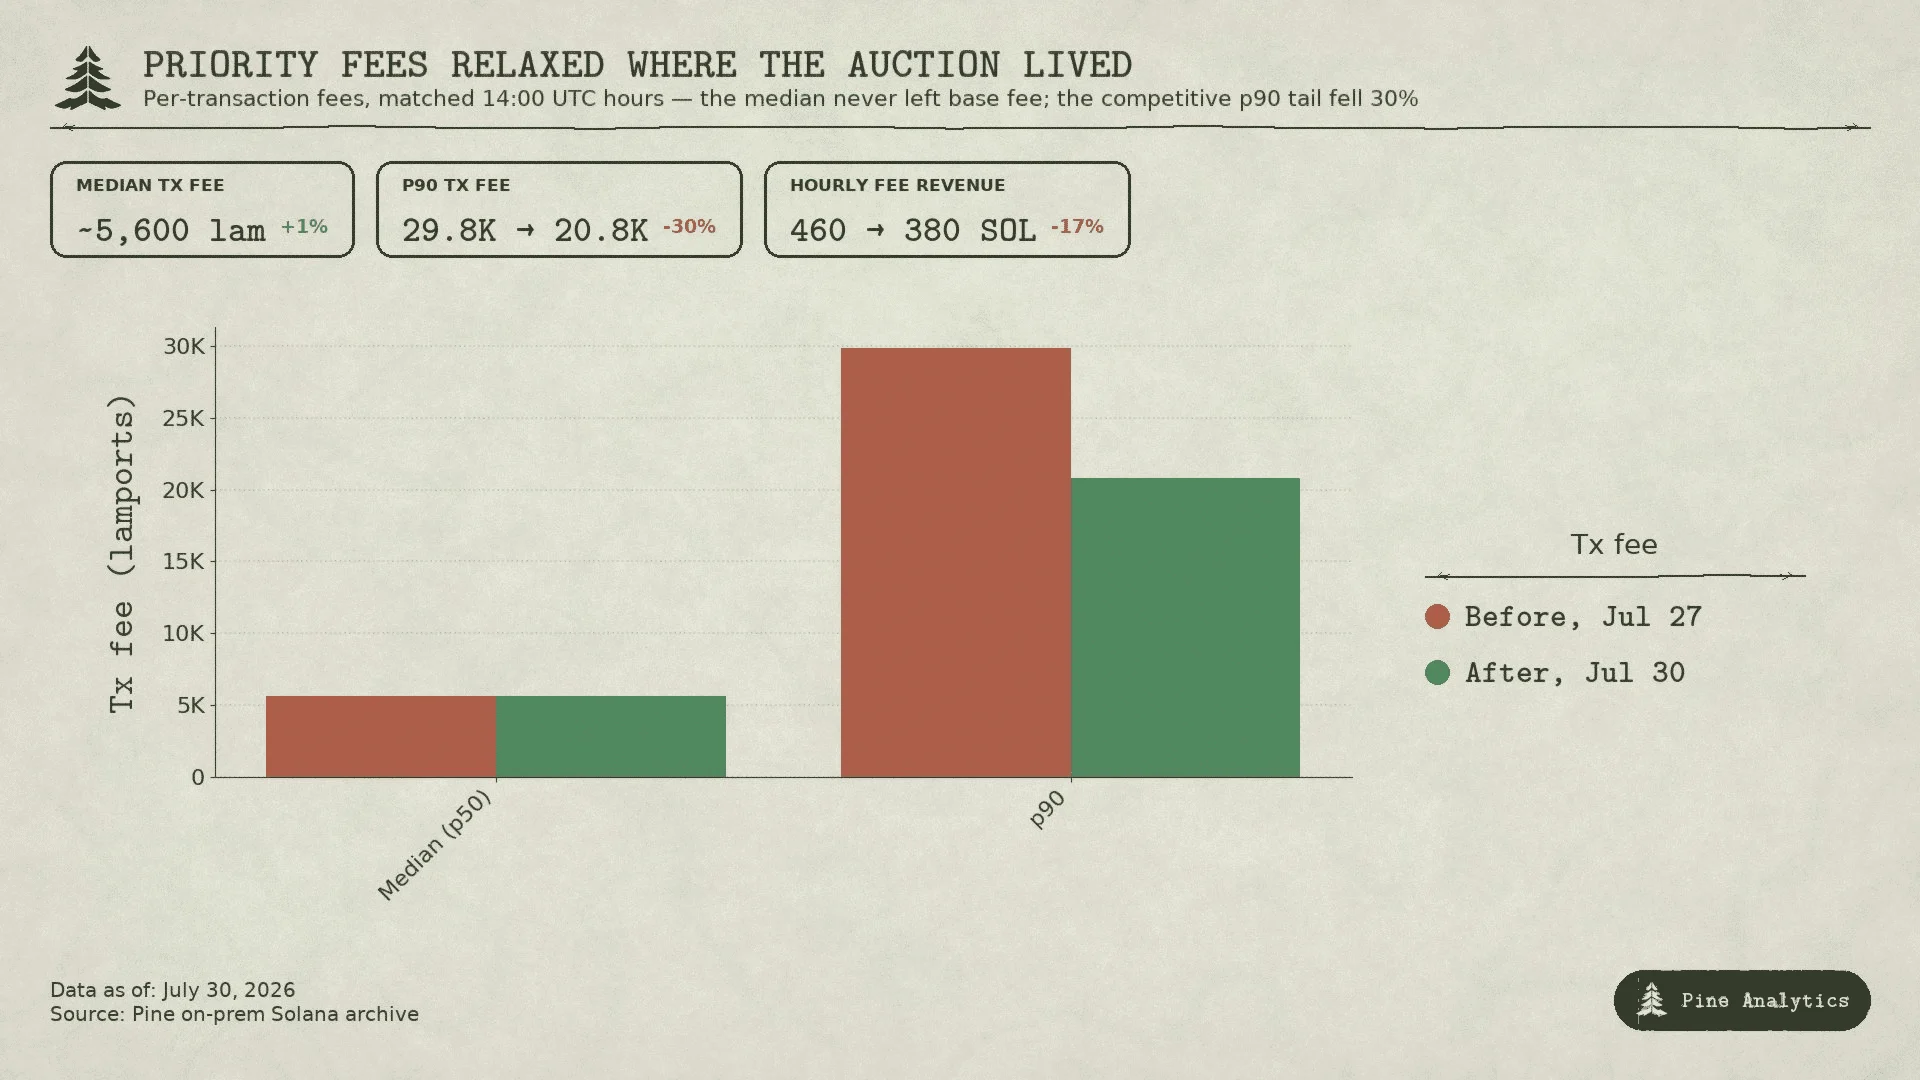
One of the most notable developments came with the activation of the SIMD-0286 upgrade at the end of July. The update increased the network’s compute capacity from 60 million to 100 million compute units, allowing the blockchain to process higher levels of activity more efficiently during periods of elevated demand.
The upgrade has also contributed to lower transaction costs. High-priority transaction fees have declined noticeably since the implementation of SIMD-0286, indicating improved throughput and better overall network efficiency.
At the same time, on-chain activity has accelerated. Recent blockchain data shows that Solana processed approximately 8.7 billion transactions during July, representing its strongest monthly transaction volume in roughly four months.
Together, these developments suggest that while SOL’s market price remains under pressure, the blockchain itself continues to strengthen through increased usage and improved performance.
Technical Setup Points to a Possible Shift
Growing network strength is beginning to coincide with a technical structure that some market participants consider constructive.
Analysts have observed that SOL is developing a breakout-and-retest formation similar to patterns seen before previous major rallies. Comparable structures appeared during earlier market cycles before significant advances, although historical performance does not guarantee future results.
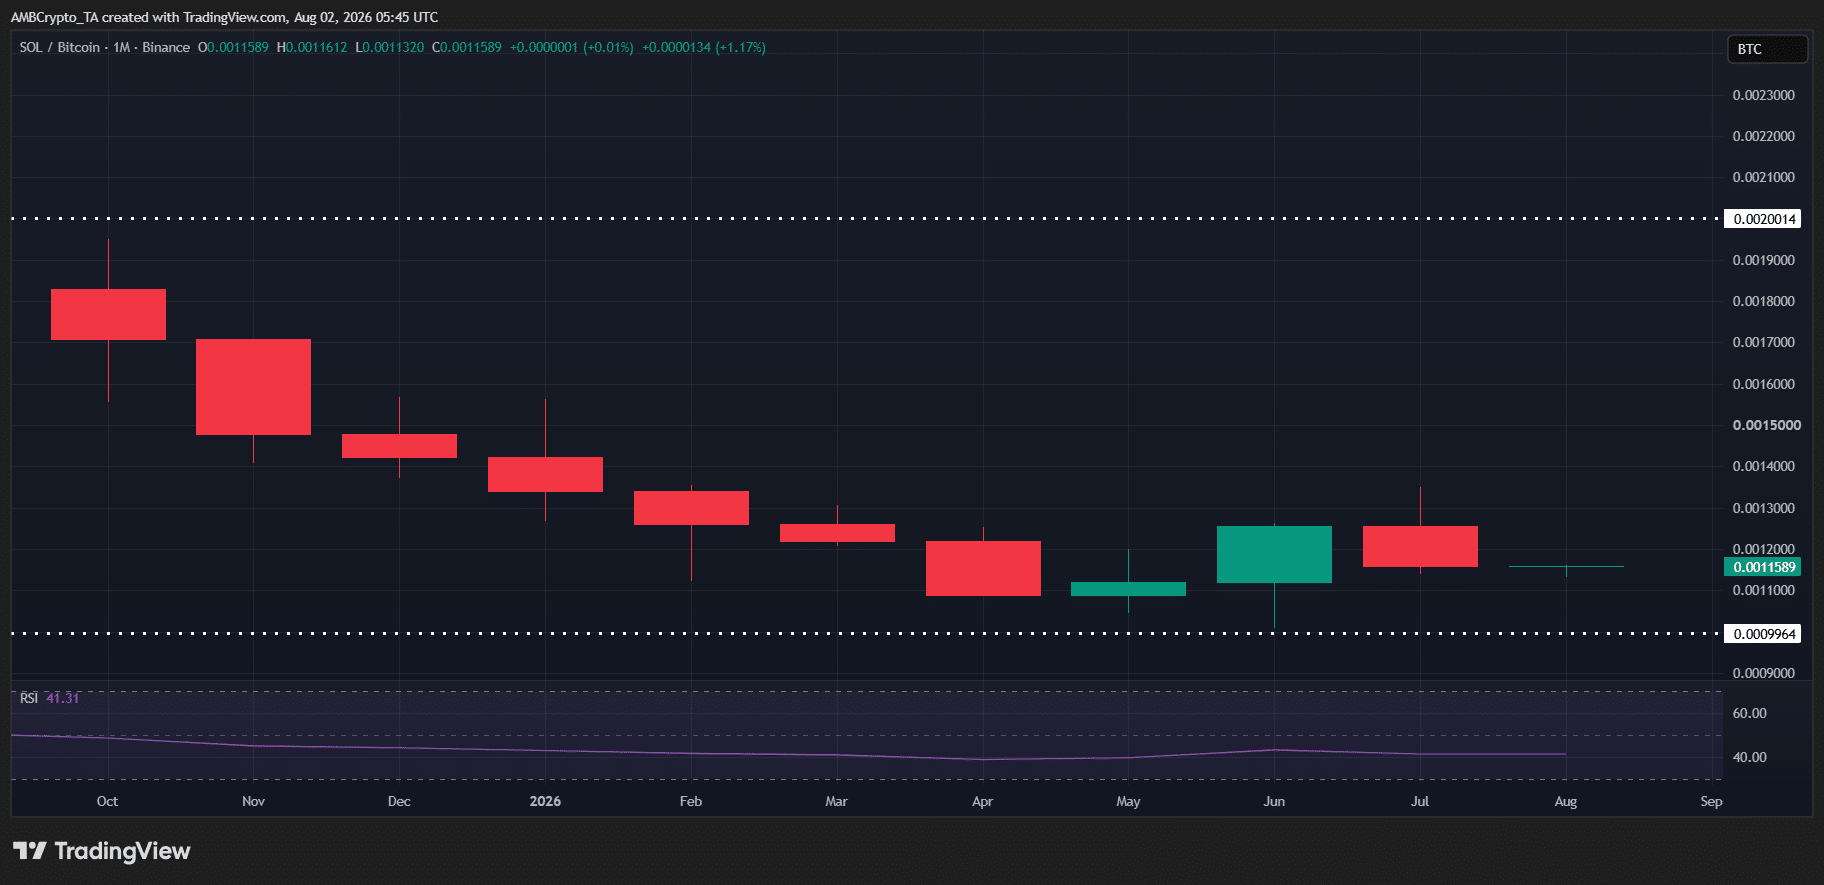
Another factor attracting attention is the seasonal behavior of the broader cryptocurrency market. Bitcoin has historically experienced relatively weaker performance during August and September, creating periods where investors sometimes rotate capital toward higher-risk altcoins.
In this environment, the SOL/BTC trading pair remains an important chart to monitor. The pair has been consolidating below a key resistance level, and a convincing breakout could indicate improving relative strength for Solana compared with Bitcoin.
Outlook
Although Solana’s price trend remains bearish, its on-chain metrics continue to move in the opposite direction. Increased network capacity, declining transaction fees, and stronger blockchain activity all point toward improving ecosystem fundamentals.
If capital begins rotating back into altcoins during the coming months and SOL/BTC establishes a sustained breakout, Solana could be positioned for a broader recovery. Until then, investors are likely to watch both network growth and key technical support levels for confirmation that momentum is beginning to shift.
Conclusion
Solana remains in a challenging price environment, but its blockchain continues to demonstrate resilience through stronger network performance and rising transaction activity. While technical confirmation is still needed, improving fundamentals provide a foundation that could support a future recovery if broader market conditions become more favorable.
