


Hyperliquid (HYPE) is approaching a decisive moment. Despite outperforming much of the crypto market this year, the token now faces growing selling pressure as its bullish structure weakens.
HYPE is trading around $72, roughly 26% below its September 23 peak of $97.99. While Bitcoin has declined about 15%, HYPE has maintained significant year-to-date gains. However, recent price action suggests that buyers may be losing control.
Technical Signals Point to Further Weakness
HYPE’s daily chart is showing several warning signs.
The token formed a lower high on October 30 after an initial price surge following Intercontinental Exchange’s (ICE) futures announcement failed to reach its previous record. It has since printed its first lower low since the August breakout, raising concerns about a possible trend reversal.
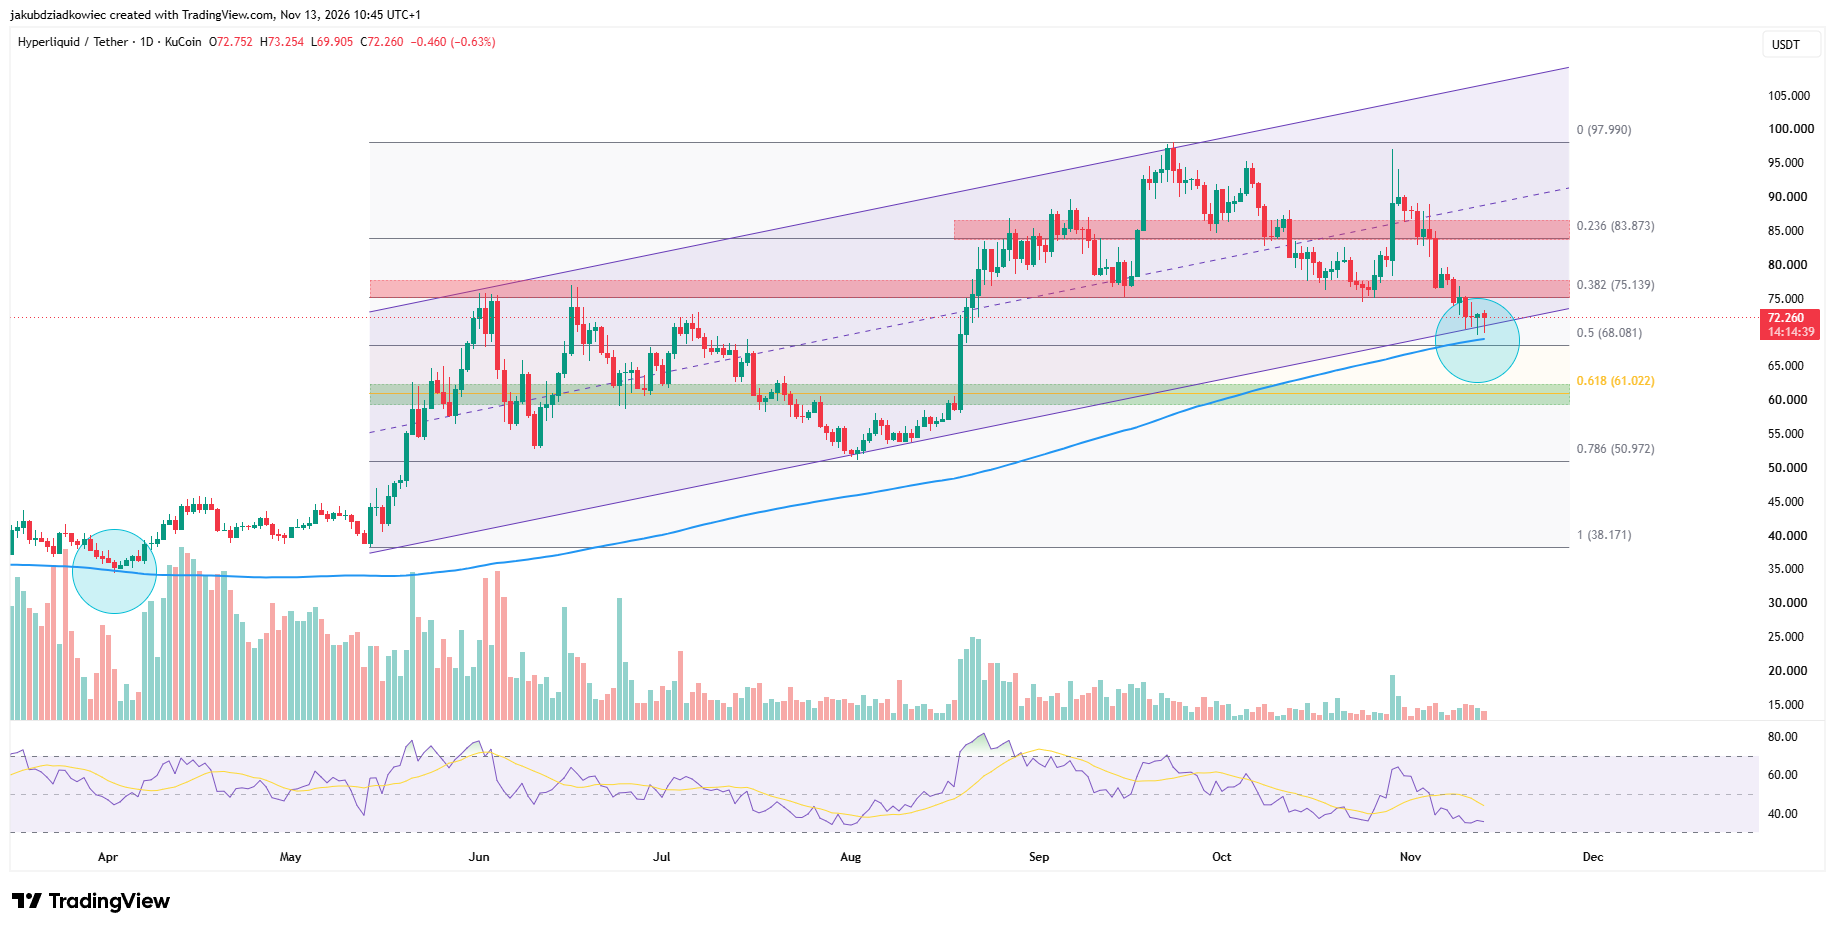
Another important development was the loss of the $75 area, which previously acted as support around the 0.382 Fibonacci retracement level.
Trading volume has also declined from its April and June peaks, while the Relative Strength Index (RSI) has dropped to approximately 35, its weakest reading since August.
Several positive developments have failed to generate a sustained recovery. These include the ICE announcement, new listings on Upbit and Bithumb on November 10, and Binance restoring HYPE withdrawals on November 8.
Selling pressure has also increased following reports that two major holders disposed of approximately $109 million worth of HYPE on October 31. Meanwhile, the Crypto Fear & Greed Index remains at 20, suggesting that market participants are still cautious.
Strong Revenue Provides a Fundamental Counterargument
Despite the weakening chart, Hyperliquid’s underlying revenue performance remains strong.
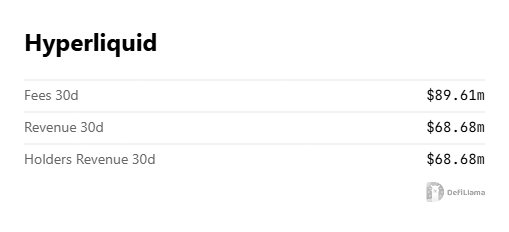
DefiLlama data shows that the protocol generated approximately $68.68 million in revenue over the past 30 days. The revenue is being directed toward token buybacks, creating ongoing demand for HYPE.
This is INSANE from $HYPE
Annualized revenue just hit nearly $1B based on the last 30 days
With only 11 people on the team, that’s roughly 90M in revenue per employee
Plus, Coinbase AQA yield is adding another $15M/month on top
99% of all this revenue goes straight to… pic.twitter.com/mq1f7D5vNT
— jussy (@jussy_world) November 12, 2026
At the current pace, this represents an estimated annual revenue run rate of around $825 million.
Another important factor is that approximately 19% of gross revenue comes from USDC reserve yield. This provides a revenue stream that is less dependent on trading activity.
Analyst Jussy has also pointed to these fundamentals as a reason to monitor the protocol’s performance closely.
However, buyback activity has so far been unable to reverse the broader price decline. This raises an important question: can strong protocol revenue provide enough support to protect HYPE’s long-term bullish structure?
The $68–$70 Zone Could Determine HYPE’s Next Move
HYPE is now approaching a major technical support area between $68 and $70.
Several indicators converge around this range:
– $69:** The 200-day moving average.
– $70:** The lower boundary of the ascending price channel.
– $68.08:** The 0.5 Fibonacci retracement level.
Buyers have already shown some interest in this region. HYPE briefly dropped to $69.91 during the latest session before finding support.
The 200-day moving average is particularly important because the previous test in April was followed by a recovery that developed into a rally starting in May.
If buyers manage to defend the current support zone, HYPE could attempt another recovery toward $75. Reclaiming that level would be an early sign that selling pressure is easing.
However, a confirmed daily close below $68–$70 would significantly weaken the bullish outlook. In that scenario, the next major downside level sits near $61, corresponding to the 0.618 Fibonacci retracement. This area also aligns with the consolidation range from June and July.
Final Outlook
HYPE is facing a clear technical challenge. Weakening momentum, declining volume, and large-holder selling have put its bullish structure under pressure.
At the same time, strong protocol revenue and ongoing buybacks provide a fundamental reason to keep watching the token.
The $68–$70 range is now the level to watch. Holding this area could give buyers an opportunity to regain control, while a breakdown may expose HYPE to another leg lower toward $61.
For now, the ability of buyers to defend this support zone may determine whether HYPE can maintain its broader bullish trend.
